Activities 747
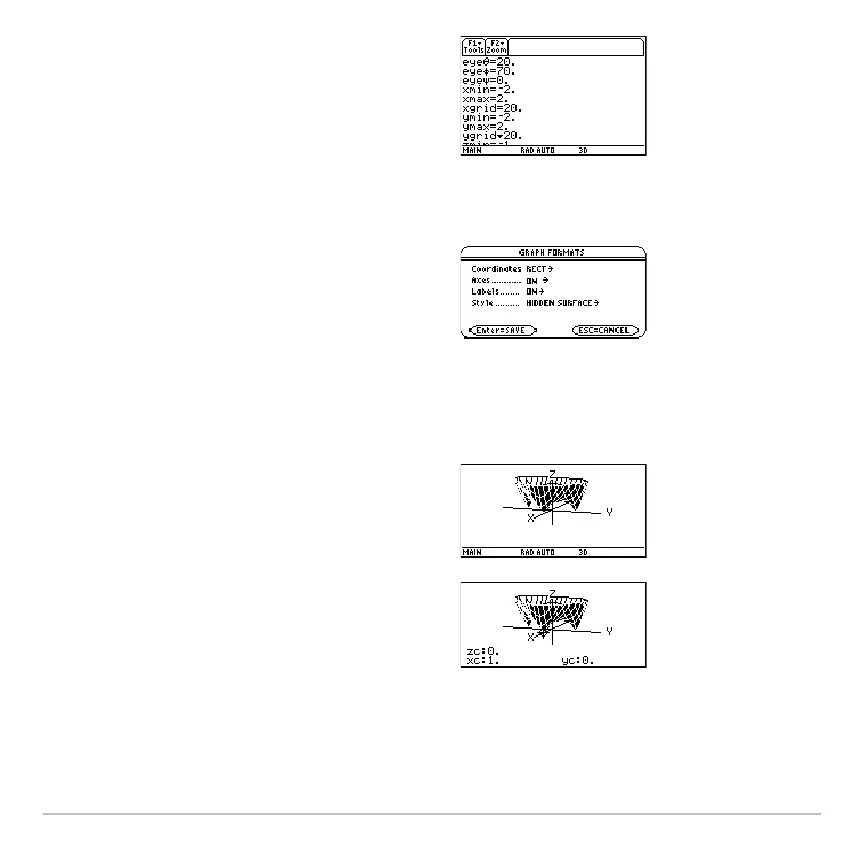
5. Set the unit to 3D graph mode, turn on the
axes for graph format, and set the
Window variables to:
eye= [20,70,0]
x= [
L2,2,20]
y= [
L2,2,20]
z= [
L1,2]
ncontour= [5]
6. In the Y=Editor, press:
@8Í
and set the Graph Format variables to:
Axes= ON
Labels= ON
Style= HIDDEN SURFACE
Note:
Calculating and drawing the graph
takes about three minutes.
7. Graph the modulus surface.
The 3D graph is used to visually display a
picture of the roots where the surface
touches the
xy plane.
8. Use the Trace tool to explore the function
values at
x=1 and y=0.

 Loading...


