5.3.2 Traffic Statistics
Traffic Statistics screen displays the detailed traffic information of each port, which facilitates you to
monitor the traffic and locate faults promptly.
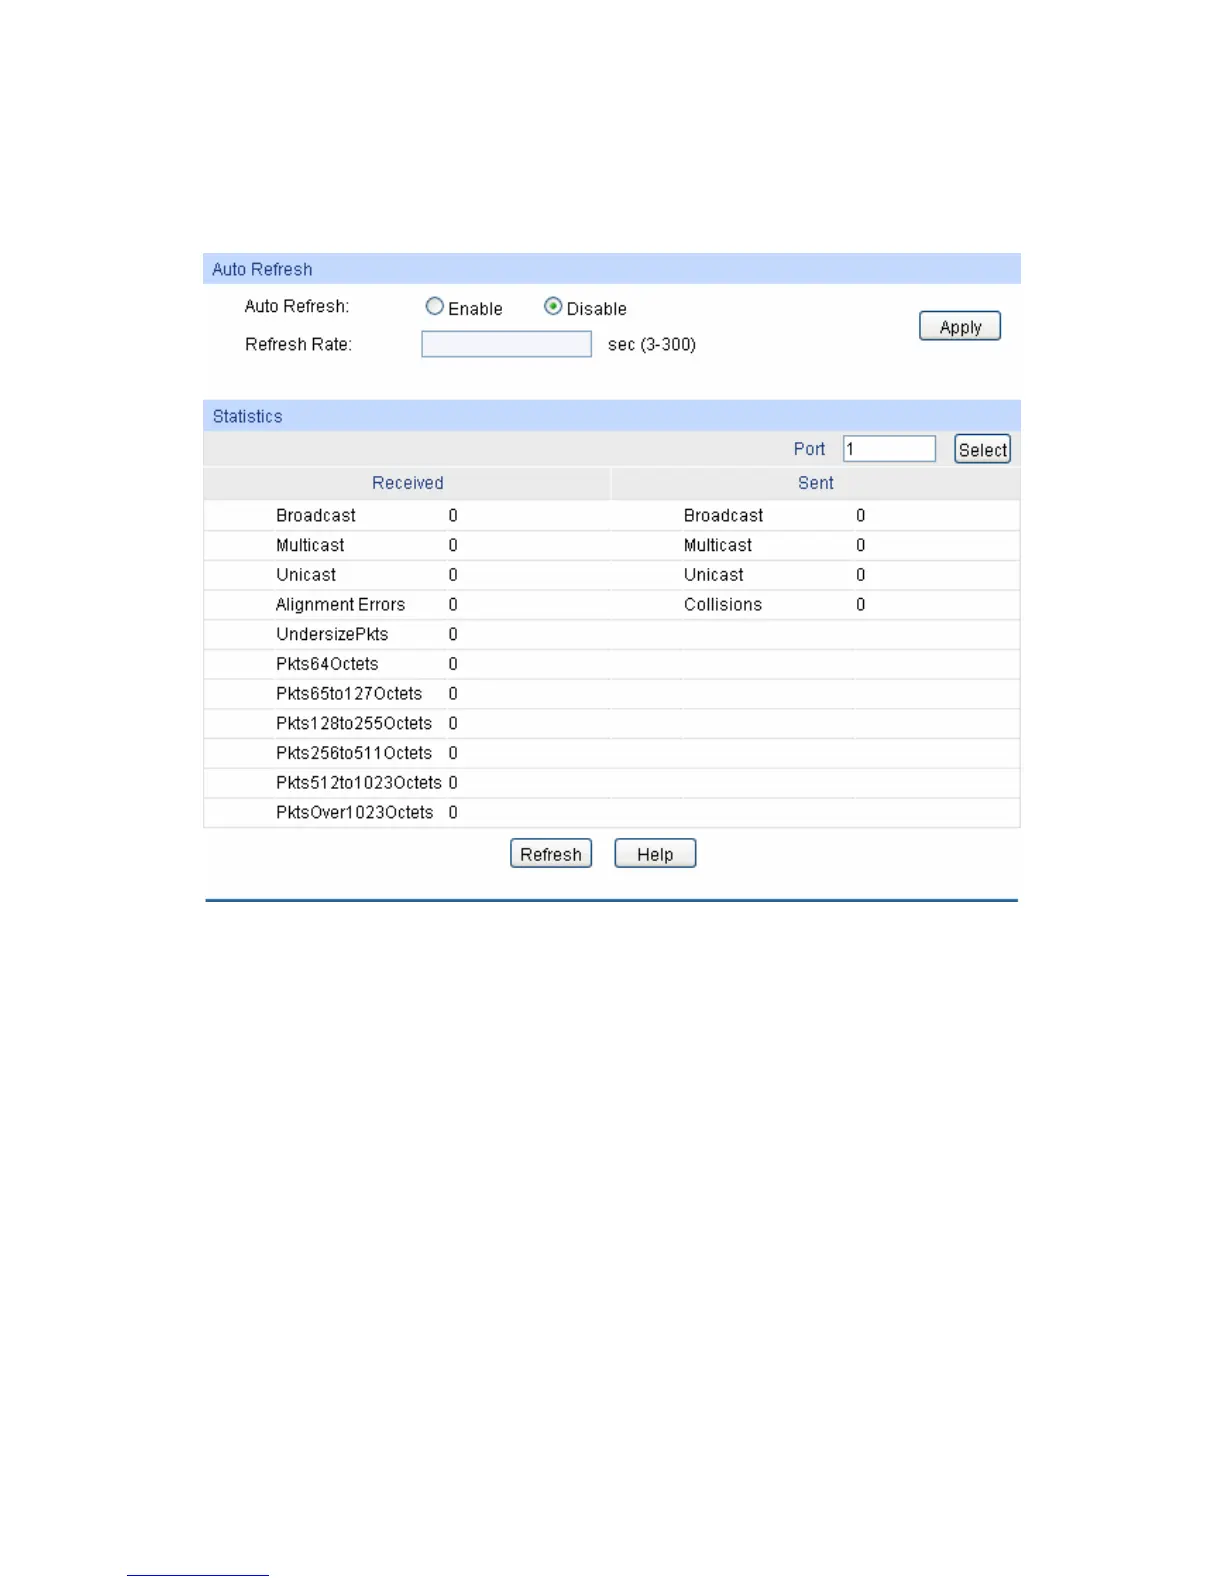
Choose the menu Switching→Traffic Monitor→Traffic Statistics to load the following page.
Figure 5-12 Traffic Statistics
The following entries are displayed on this screen:
¾ Auto Refresh
Auto Refresh: Allows you to Enable/Disable refreshing the Traffic Summary
automatically.
Refresh Rate: Enter a value in seconds to specify the refresh interval.
¾ Statistics
Port: Enter a port number and click the Select button to view the traffic
statistics of the corresponding port.
Received: Displays the details of the packets received on the port.
Sent: Displays the details of the packets transmitted on the port.
Broadcast: Displays the number of good broadcast packets received o
transmitted on the port. The error frames are not counted in.
Multicast: Displays the number of good multicast packets received o
 Loading...