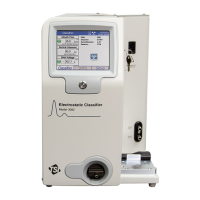
5-14 Electrostatic Classifier Model 3082 and SMPS Spectrometer Model 3938
Table 5-4
Y-axis Settings
Specify range over which data will be scaled. Use alphanumeric
on-screen keyboard to specify min and max. Note that data
cannot be scaled logarithmically.
Reset the y-axis scale to the full range of measurement. Max
and Min will be grayed out.
Specify how the size distribution is weighted for data and
statistics on the SMPS screen.
Represents the number concentration (the
total number of particles per unit volume of air
sampled expressed as #/cm
3
).
Represents the surface concentration (total
surface area of the particles per unit volume of
air sampled expressed as nm
2
/cm
3
).
Represents the volume concentration (total
volume of particles per unit volume of air
sampled expressed as nm
3
/cm
3
).
Represents the mass concentration (total
mass of the particles per unit volume of air
sampled expressed as μg/ cm
3
).
Specify y-axis units for data and statistics on the SMPS screen.
Represents interval particle size distributions.
The concentration in any channel represents
the concentration within the particle size
boundaries for that channel.
Differential or normalized particle size
distribution, normalized to one decade of
particle size. This normalized concentration
format allows particle size distributions to be
compared regardless of the channel
resolution. Default unit used.
Displays each particle size channel as a
percentage of the total particle concentration.
Applies to data within View Boundaries only.
Cumulative concentration displays the particle
concentration in a cumulative (summed)
format. Each particle size channel represents
the total concentration of particles measured
below its upper size boundary. Applies to data
within View Boundaries only.
Cumulative % concentration is the same as
cumulative concentration but displayed as a
percentage of the total concentration. Applies
to data within View Boundaries only.
Used in the mass and d50 calculations. Set to 1.0 (g/cm
3
) by
default.
Return to main screen. Graph and statistics will be updated
based on your selections.
Return to main screen and cancel any changes to y-axis
settings.
 Loading...