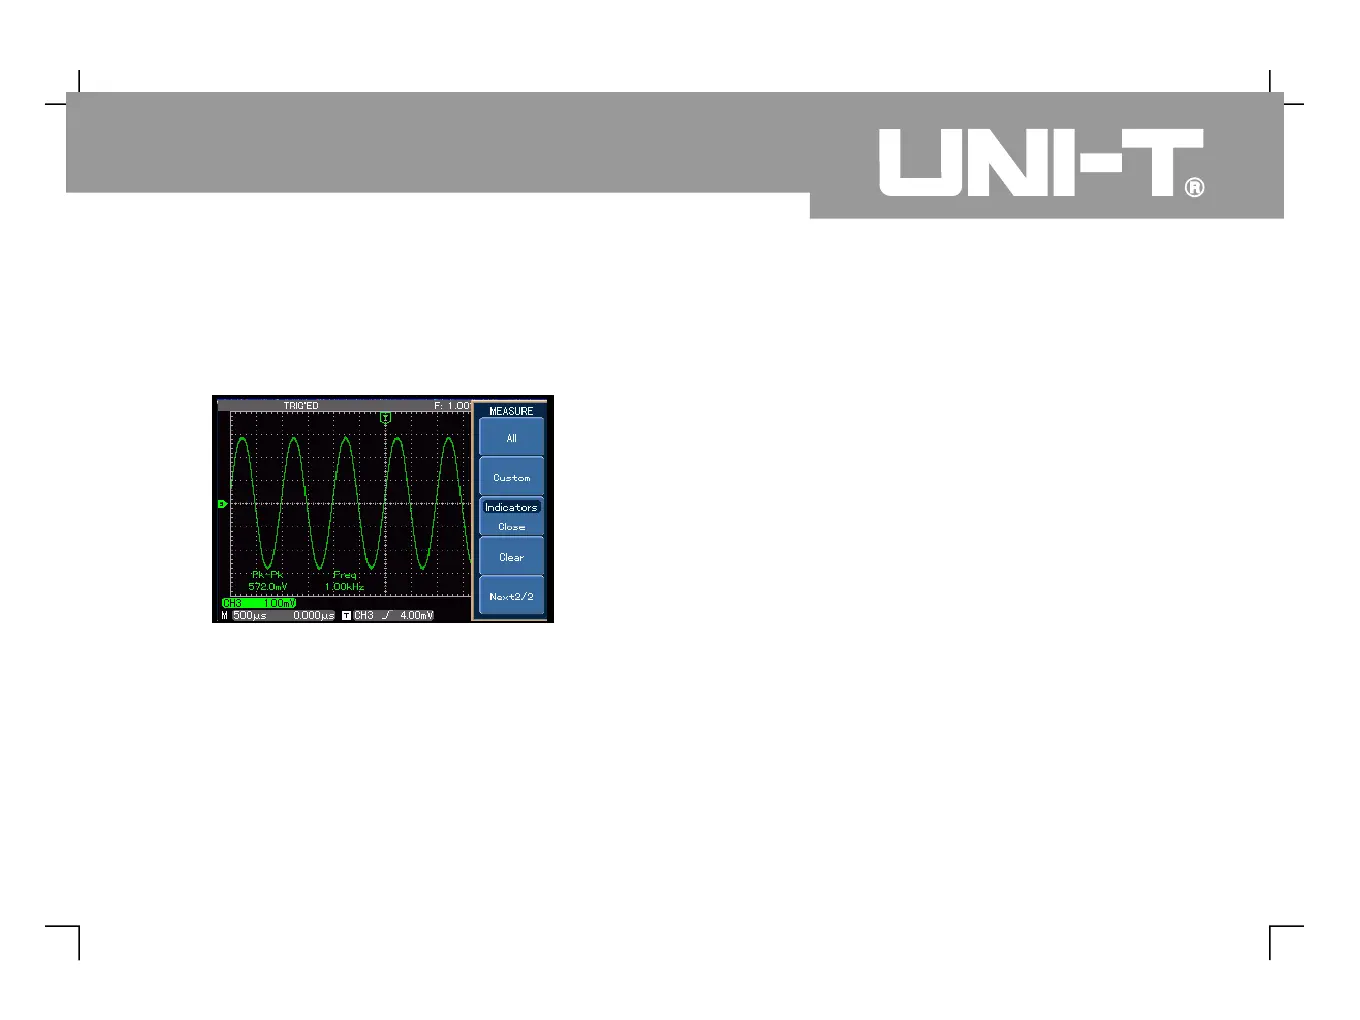
Peak-to-peak and frequency measurements will now
appear at the bottom of the screen, as shown in
As in the previous scenario, set the probe attenuation
factor of the probe and oscilloscope channel to 10X.
Connect the CH1 to the circuit signal input terminal
Connect CH2 to the output terminal
Continue to adjust the horizontal and vertical
range until you get the desired waveform display.
Press [ ] to select CH1. Adjust vertical
position of the CH1 waveform by turning the
vertical position control knob.
Press [ ] to select CH2. In the same way
described above, adjust vertica
CH2 waveform so that the waveforms of CH1 and
CH2 do not overlap. This will make observation
Illustration 2 : Observing the delay caused by a
sine wave signal passes through the circuit
1. To display CH1 and CH2 signals :
Figure 3-1 Automatic measurement
 Loading...