2-11
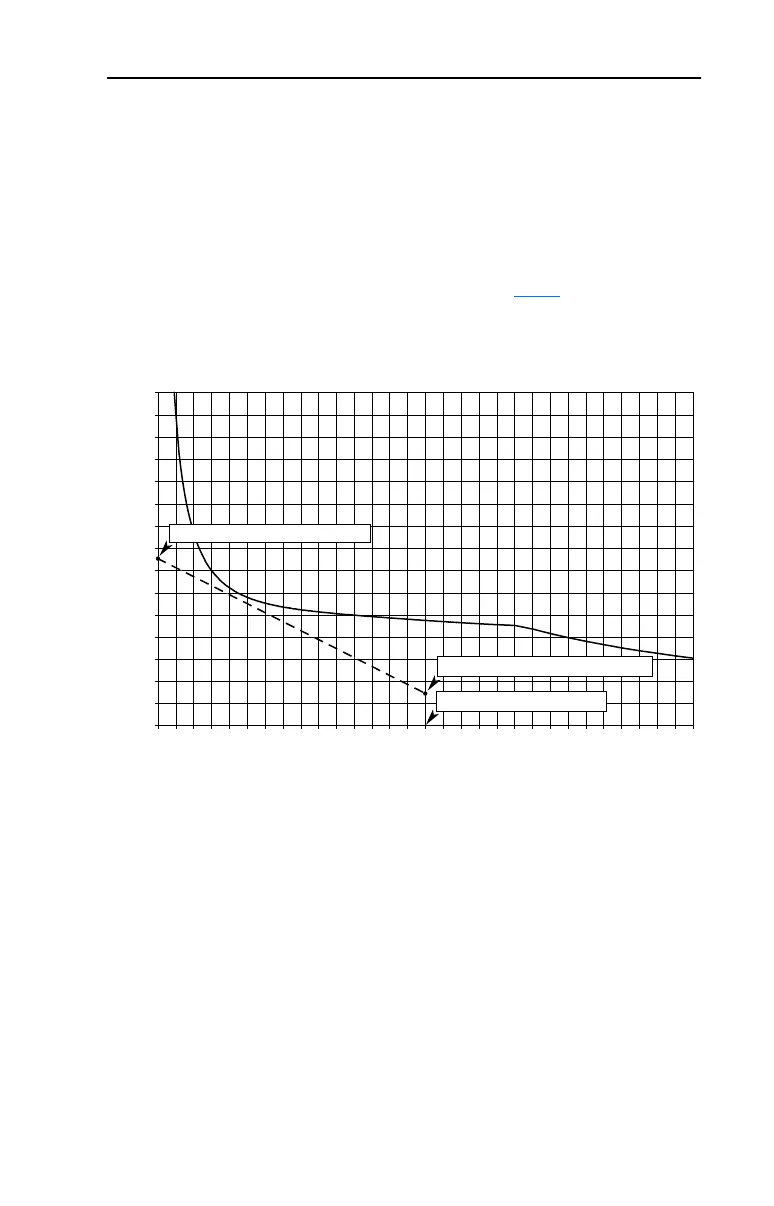
This is the result of the calculation outlined in Step 6. This point is
plotted at zero seconds moving up vertically to this percentage.
Figure 2.2 Resistor Power Curve
AL and PL are plotted and connected with a dotted line. This is the Motor
Power Curve. If any portion of this curve lies to the right of the constant
temperature power curve of the Dynamic Brake Resistor, the resistor
element temperature will exceed the operating temperature limit. The
drive will protect the resistor and shut down the Chopper transistor. The
drive will then likely trip on an overvoltage fault.
Percent Peak Load PL 100
P
b
P
db
--------
×==
PL 100
608.6
40
------------
× 1521%==
0 1 2 3 4 5 6 7 8 9 101112131415161718192021222324252627282930
Decel Time (Seconds)
% Peak Power
0
200
400
600
800
1000
1200
1400
1600
1800
2000
2200
2400
2600
2800
3000
PL (Peak Percent Load) = 1521%
AL (Average Percent Load) = 285%
Decel Time = 15.0 Seconds
 Loading...