Section 3
Record the values calculated in Section 2.
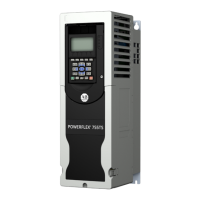
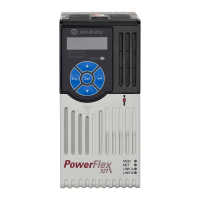
PowerFlex 70 Drives
Find the correct Figure for your PowerFlex 70 drive rating.
1. Plot the point where the value of AL (Average Load), calculated in
Step 5, and the desired deceleration time (t
3
– t
2
) intersect.
2. Plot the value of PL (Peak Load), calculated in
Step 6, on the vertical
axis (0 seconds).
3. Connect PL at 0 seconds and AL at (t
3
– t
2
) with a straight line. This
line is the power curve described by the motor as it decelerates to
minimum speed.
If the power curve lies to the left of the constant temperature power
curve of the Dynamic Brake Resistor, then there is no problem with the
intended application. If any portion of the power curve lies to the right of
the constant temperature power curve of the Dynamic Brake Resistor,
then there is an application problem. The Internal Dynamic Brake
Resistor will exceed its rated temperature during the interval that the
transient power curve is to the right of the resistor power curve capacity.
Evaluating the Capability of the Internal Dynamic Brake Resistor
AL =
PL =
t
3
– t
2
=
Drive Voltage Frame(s) Figure Number
240 A and B 3.1
240 C 3.2
240 D 3.3
480 A and B 3.4
480 C 3.5
480 D 3.6
 Loading...
