EasyManuals Logo
Home>Casio>Calculator>FX-9750G

Casio FX-9750G User Manual

Casio FX-9750G
436 pages
To Next Page IconTo Next Page
To Previous Page IconTo Previous Page
Page #170 background imageLoading...
Page #170 background image
144
3. Press w to draw the graph.
w
uu
uu
uTo graph inequalities
You can graph inequalities that can be expressed in the following four formats.
• y > f
(x)
• y < f
(x)
•
y > f
(x)
• y < f
(x)
Example To graph the inequality y > x
2
– 2x – 6
Use the following View Window parameters.
Xmin = –6 Ymin = –10
Xmax = 6 Ymax = 10
Xscale = 1 Yscale = 5
1. In the set-up screen, specify the appropriate graph type for Func Type.
!Zc6(g)1(Y>)J
2. Input the inequality.
!4(Sketch)1(Cls)w
5(GRPH)6(g)
1(Y>)vx-cv-g
3. Press w to draw the graph.
w
8 - 5 Drawing Graphs Manually
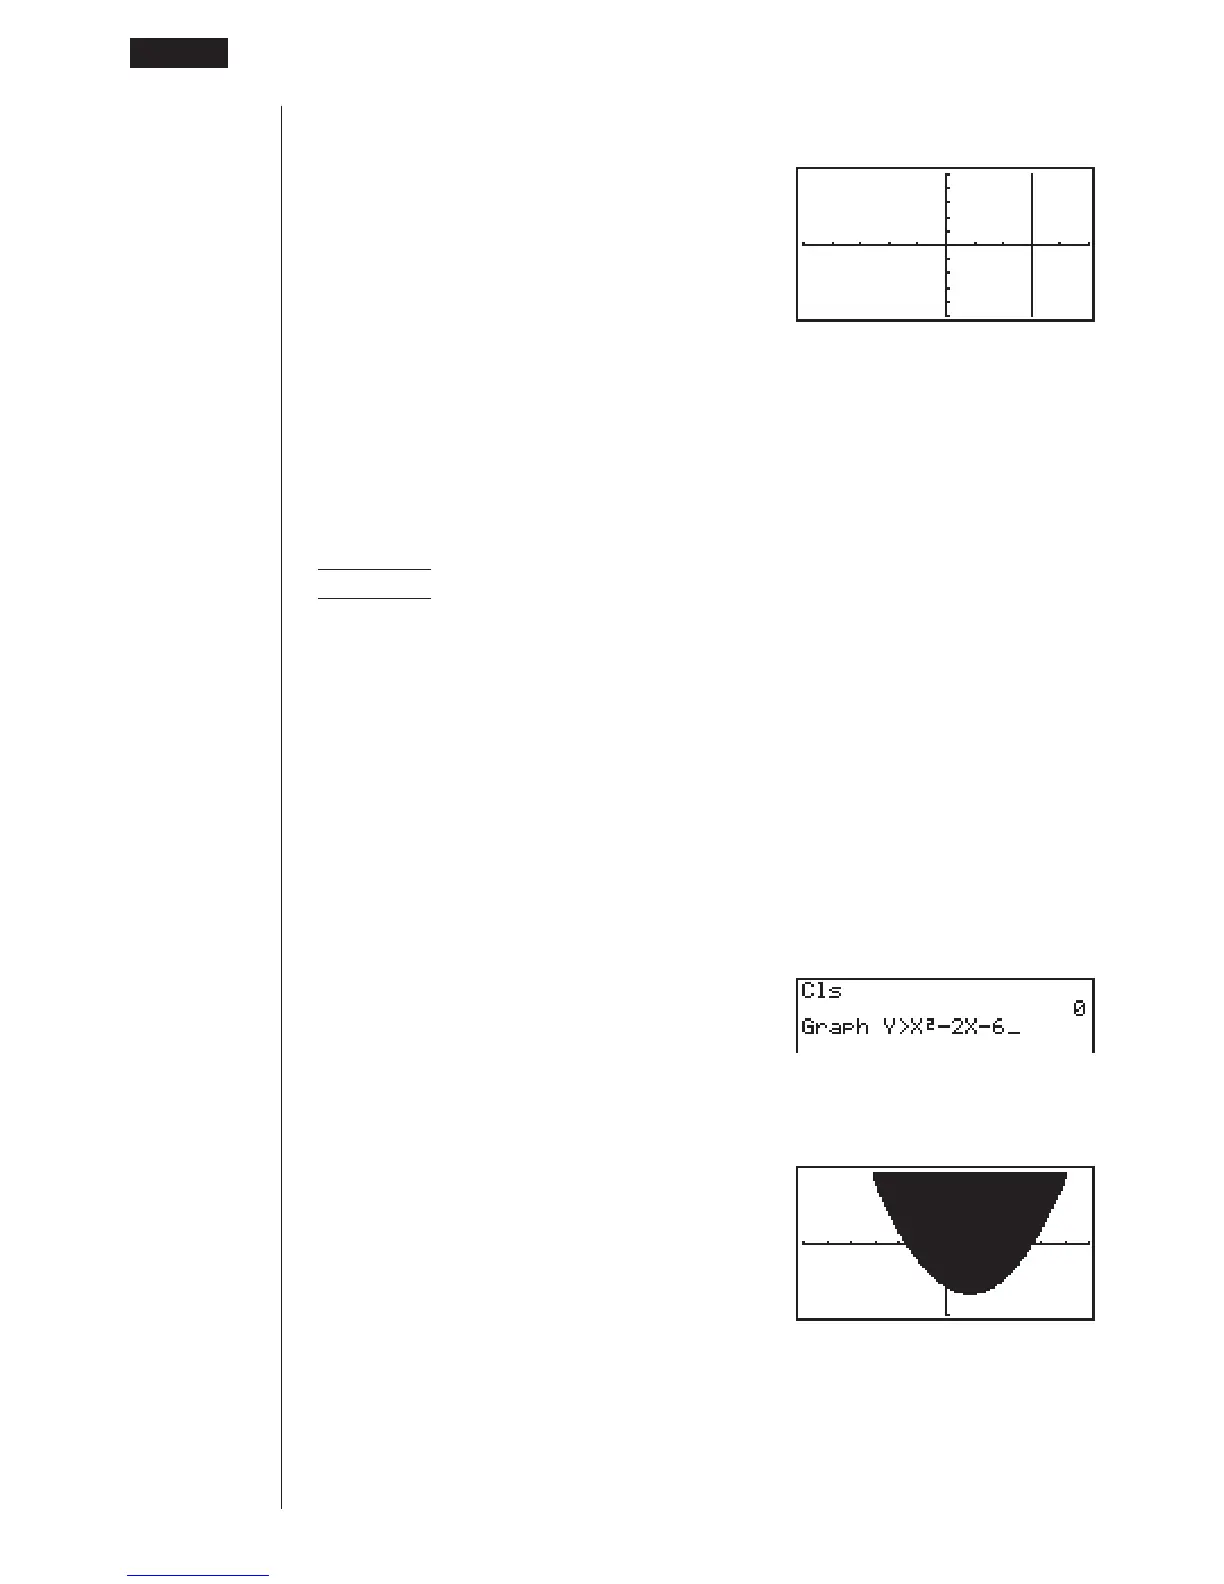
Table of Contents

Other manuals for Casio FX-9750G

Questions and Answers:

Question and Answer IconNeed help?

Do you have a question about the Casio FX-9750G and is the answer not in the manual?

Casio FX-9750G Specifications

General IconGeneral
BrandCasio
ModelFX-9750G
CategoryCalculator
LanguageEnglish

Related product manuals