306
Now you can press f and c to view variable characteristics.
For details on the meanings of these statistical values, see “Displaying Single-Vari-
able Statistical Results”.
kk
kk
k Paired-Variable Statistical Calculations
In the previous examples from “Linear Regression Graph” to “Power Regression
Graph,” statistical calculation results were displayed after the graph was drawn. These
were numeric expressions of the characteristics of variables used in the graphic
display.
The following operation produces the same values directly from the statistical data
list.
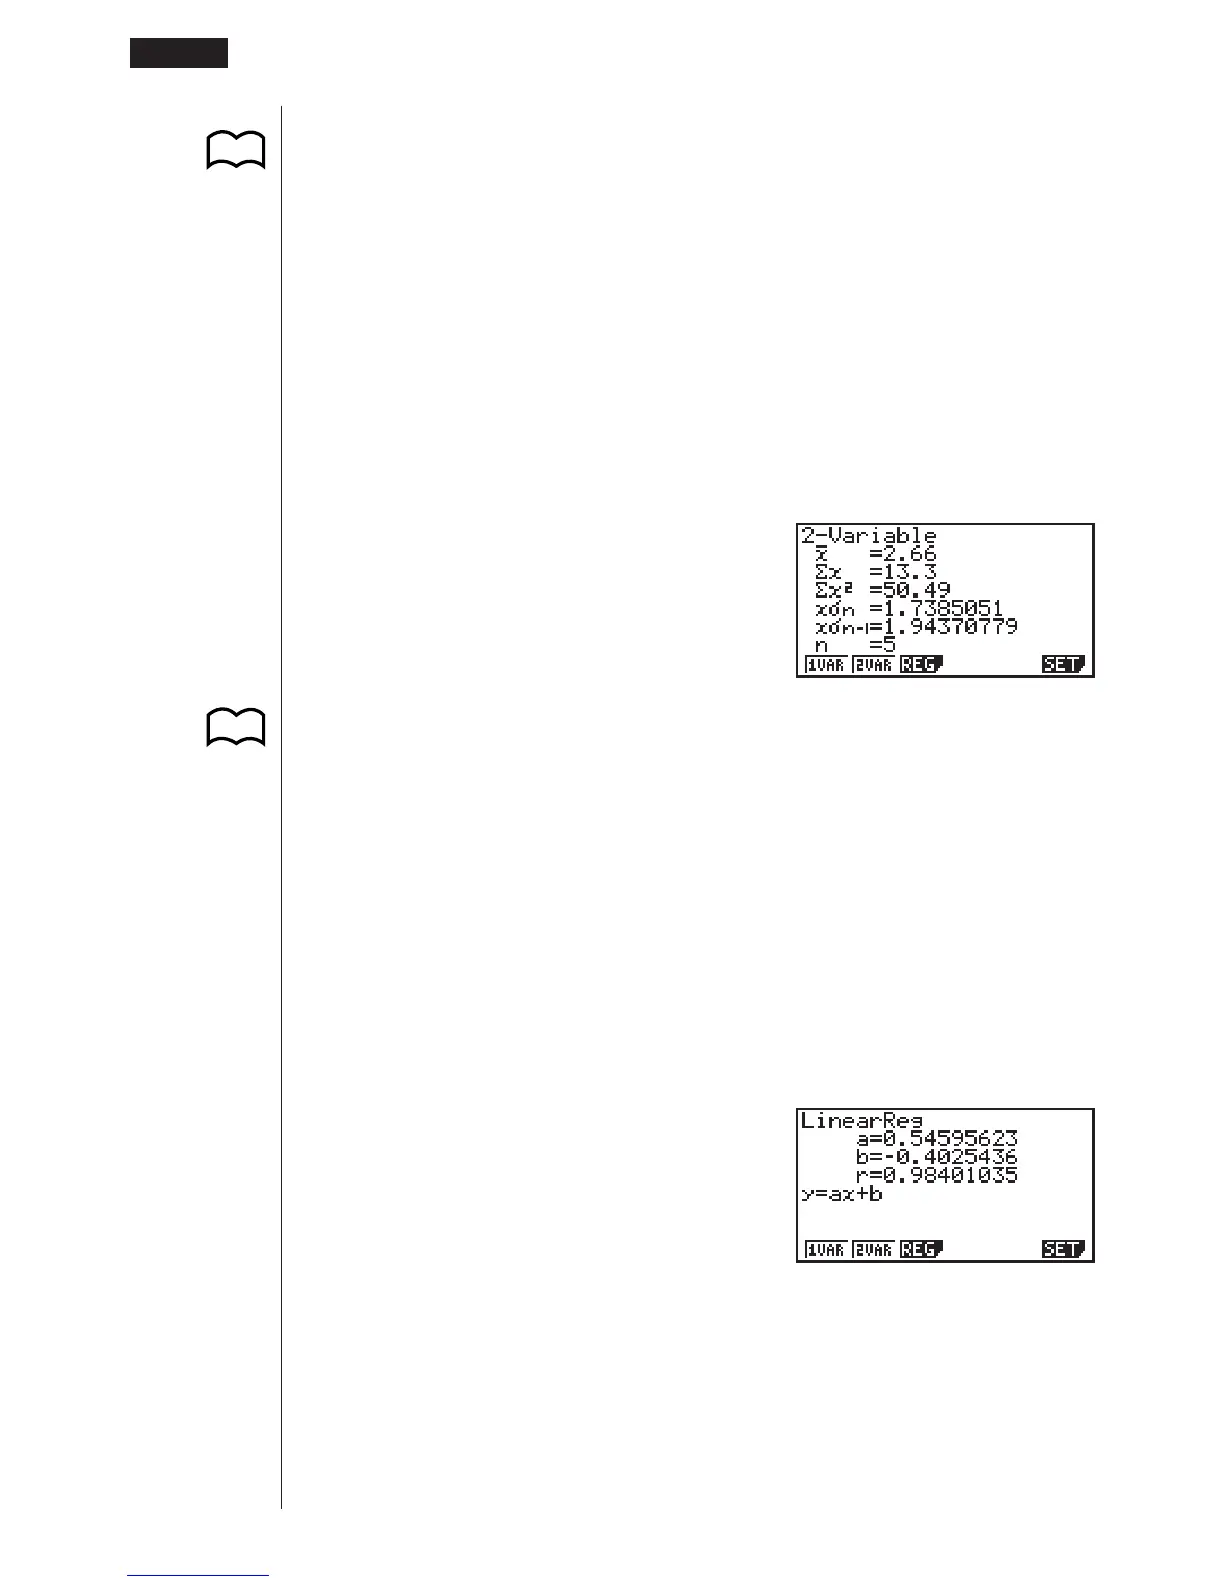
2(CALC)2(2VAR)
Now you can press f and c to view variable characteristics.
For details on the meanings of these statistical values, see “Displaying Paired-Vari-
able Statistical Results”.
kk
kk
k Regression Calculation
In the explanations from “Linear Regression Graph” to “Power Regression Graph,”
regression calculation results were displayed after the graph was drawn. Here, the
regression line and regression curve is represented by mathematical expressions.
You can directly determine the same expression from the data input screen.
Perform the following key operation.
2(CALC)3(REG)
1(X)
Single variable regression parameters are displayed.
P.301
P.296
18 - 6 Performing Statistical Calculations
 Loading...