292
kk
kk
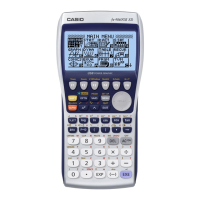
k Drawing an xy Line Graph
Paired data items can be used to plot a scatter diagram. A scatter diagram where the
points are linked is an xy line graph.
Press J or !Q to return to the statistical data list.
kk
kk
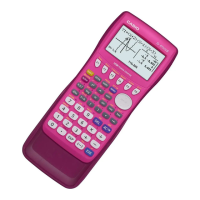
k Selecting the Regression Type
After you graph statistical data, you can use the function menu at the bottom of the
display to select from a variety of different types of regression.
1 (X) ............ Linear regression graph
2 (Med) ....... Med-Med graph
3 (X^2) ........ Quadratic regression graph
4 (X^3) ........ Cubic regression graph
5 (X^4) ........ Quartic regression graph
6 (g) ........... Next menu
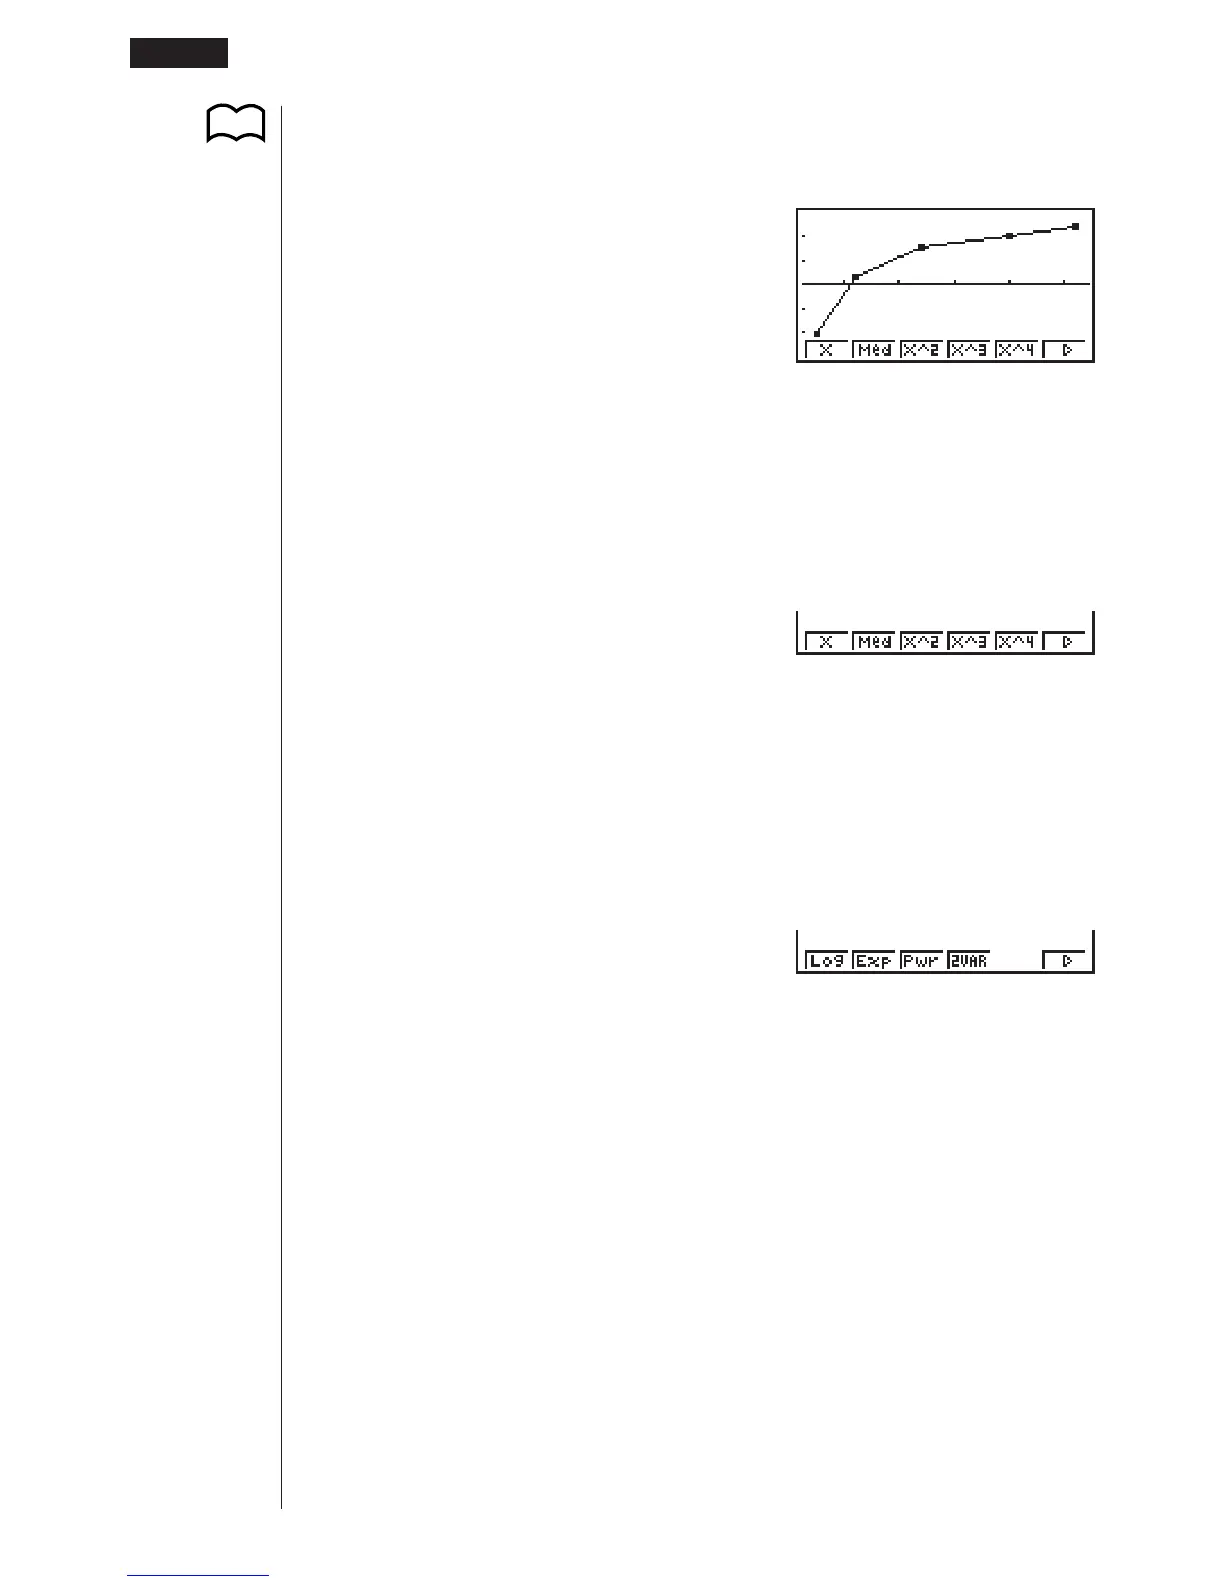
6(g)
1 (Log) ........ Logarithmic regression graph
2 (Exp) ........ Exponential regression graph
3 (Pwr) ........ Power regression graph
4 (2VAR) ..... Paired-variable statistical results
6 (g) ........... Previous menu
18 - 2 Paired-Variable Statistical Calculation Examples
P.289
(Graph Type)
(xy)
123456
12345 6
 Loading...