296
18 - 3 Calculating and Graphing Single-Variable Statistical Data
kk
kk
k Displaying Single-Variable Statistical Results
Single-variable statistics can be expressed as both graphs and parameter values.
When these graphs are displayed, the menu at the bottom of the screen appears as
below.
1 (1VAR) ..... Single-variable calculation result menu
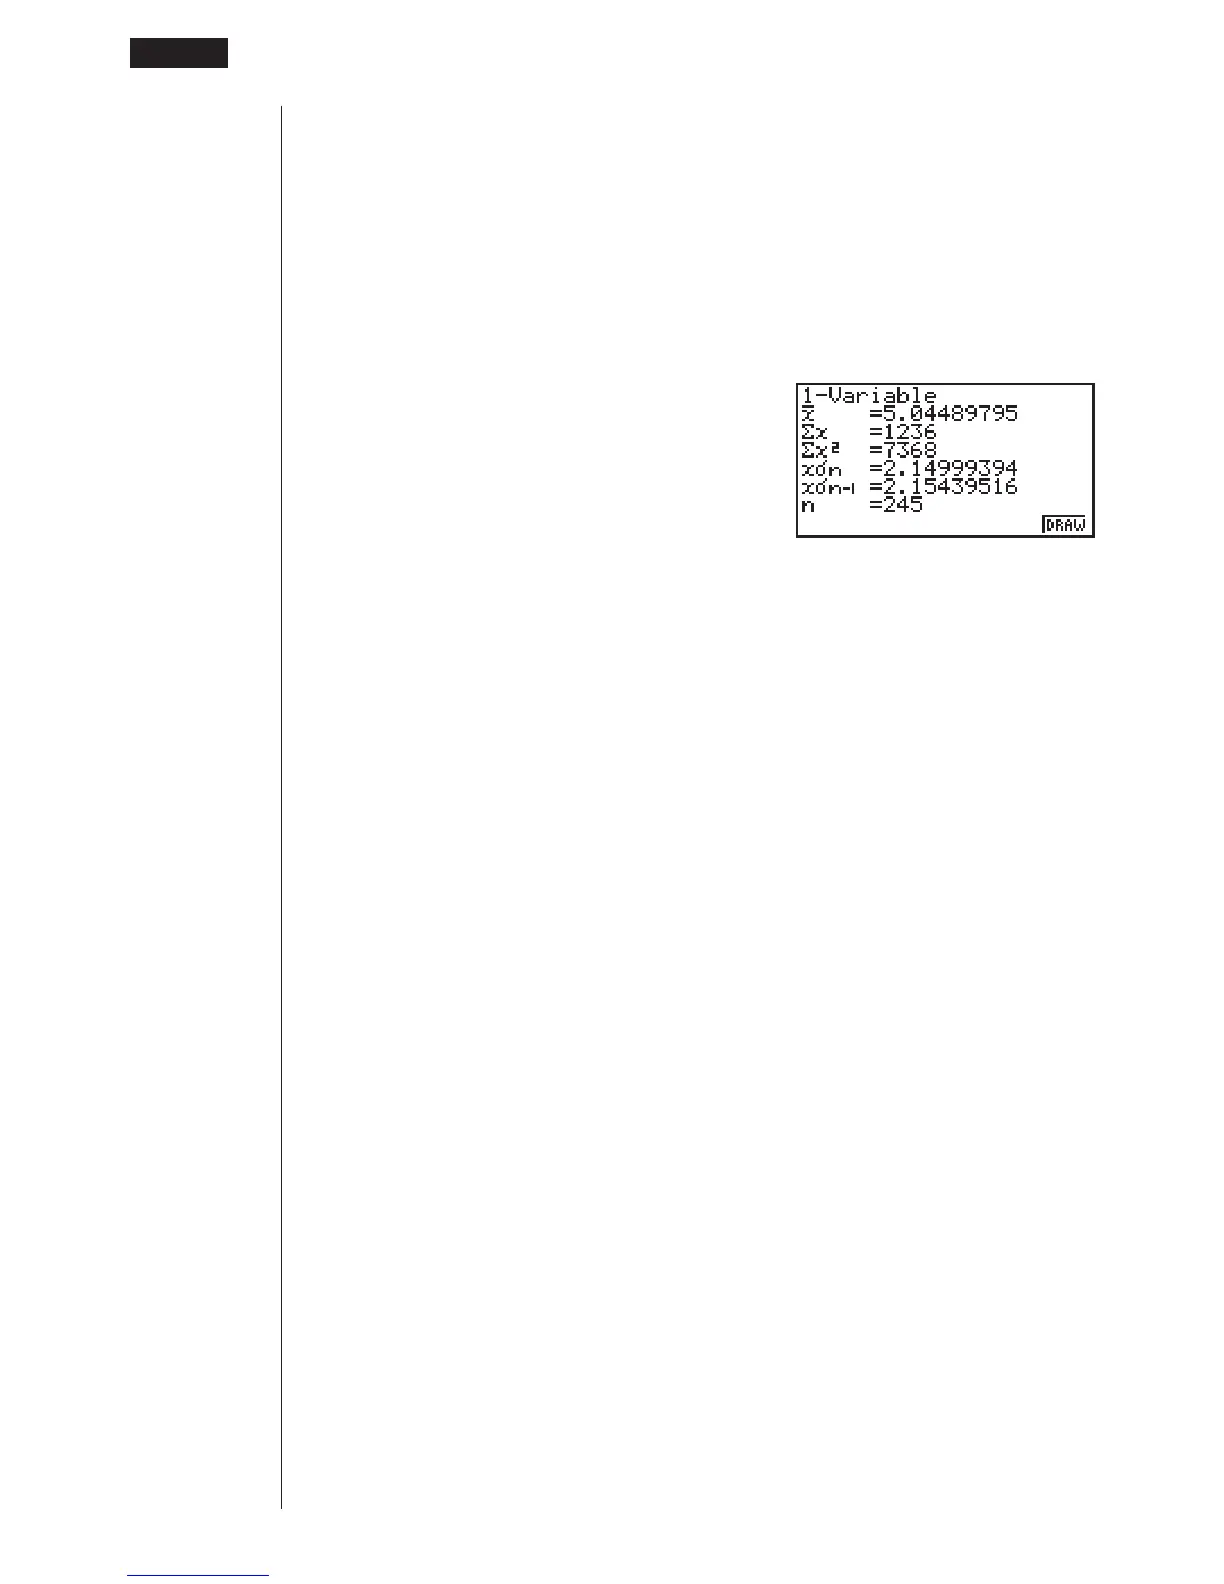
Pressing 1 (1VAR) displays the following screen.
1(1VAR)
• Use c to scroll the list so you can view the items that run off the bottom of the
screen.
The following describes the meaning of each of the parameters.
_
x ..................... Mean of data
$x ................... Sum of data
$x
2
.................. Sum of squares
x#n .................. Population standard deviation
x#n-1 ................ Sample standard deviation
n ..................... Number of data items
minX ............... Minimum
Q1 .................. First quartile
Med ................ Median
Q3 .................. Third quartile
_
x –x#n ............ Data mean – Population standard deviation
_
x + x#n ............ Data mean + Population standard deviation
maxX .............. Maximum
Mod ................ Mode
• Press 6 (DRAW) to return to the original single-variable statistical graph.
 Loading...