155
2. Press 5 (AUTO).
5(AUTO)
• You can use auto View Window with any type of graph.
• You cannot use auto View Window inside a program.
• You can use auto View Window with a graph produced by a multi-statement
connected by “:”, even if the multi-statement includes non-graph operations.
• When auto View Window is used in a statement that uses a display result com-
mand (^) to draw a graph, auto View Window parameters are applied up to
the display result command, but any graphs drawn after the display result com-
mand are drawn according to normal graph overdraw rules.
kk
kk
k Adjusting the Ranges of a Graph (SQR)
This function makes the View Window x-range value the same as the y-range value.
It is helpful when drawing circular graphs.
Example To graph r = 5sin
"
and then adjust the graph.
Use the following View Window parameters.
Xmin = –8 Ymin = –1
Xmax = 8 Ymax = 5
Xscale = 1 Yscale = 1
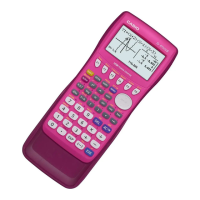
1. After drawing the graph, press 2 (Zoom) 6 (g).
2(Zoom)6(g)
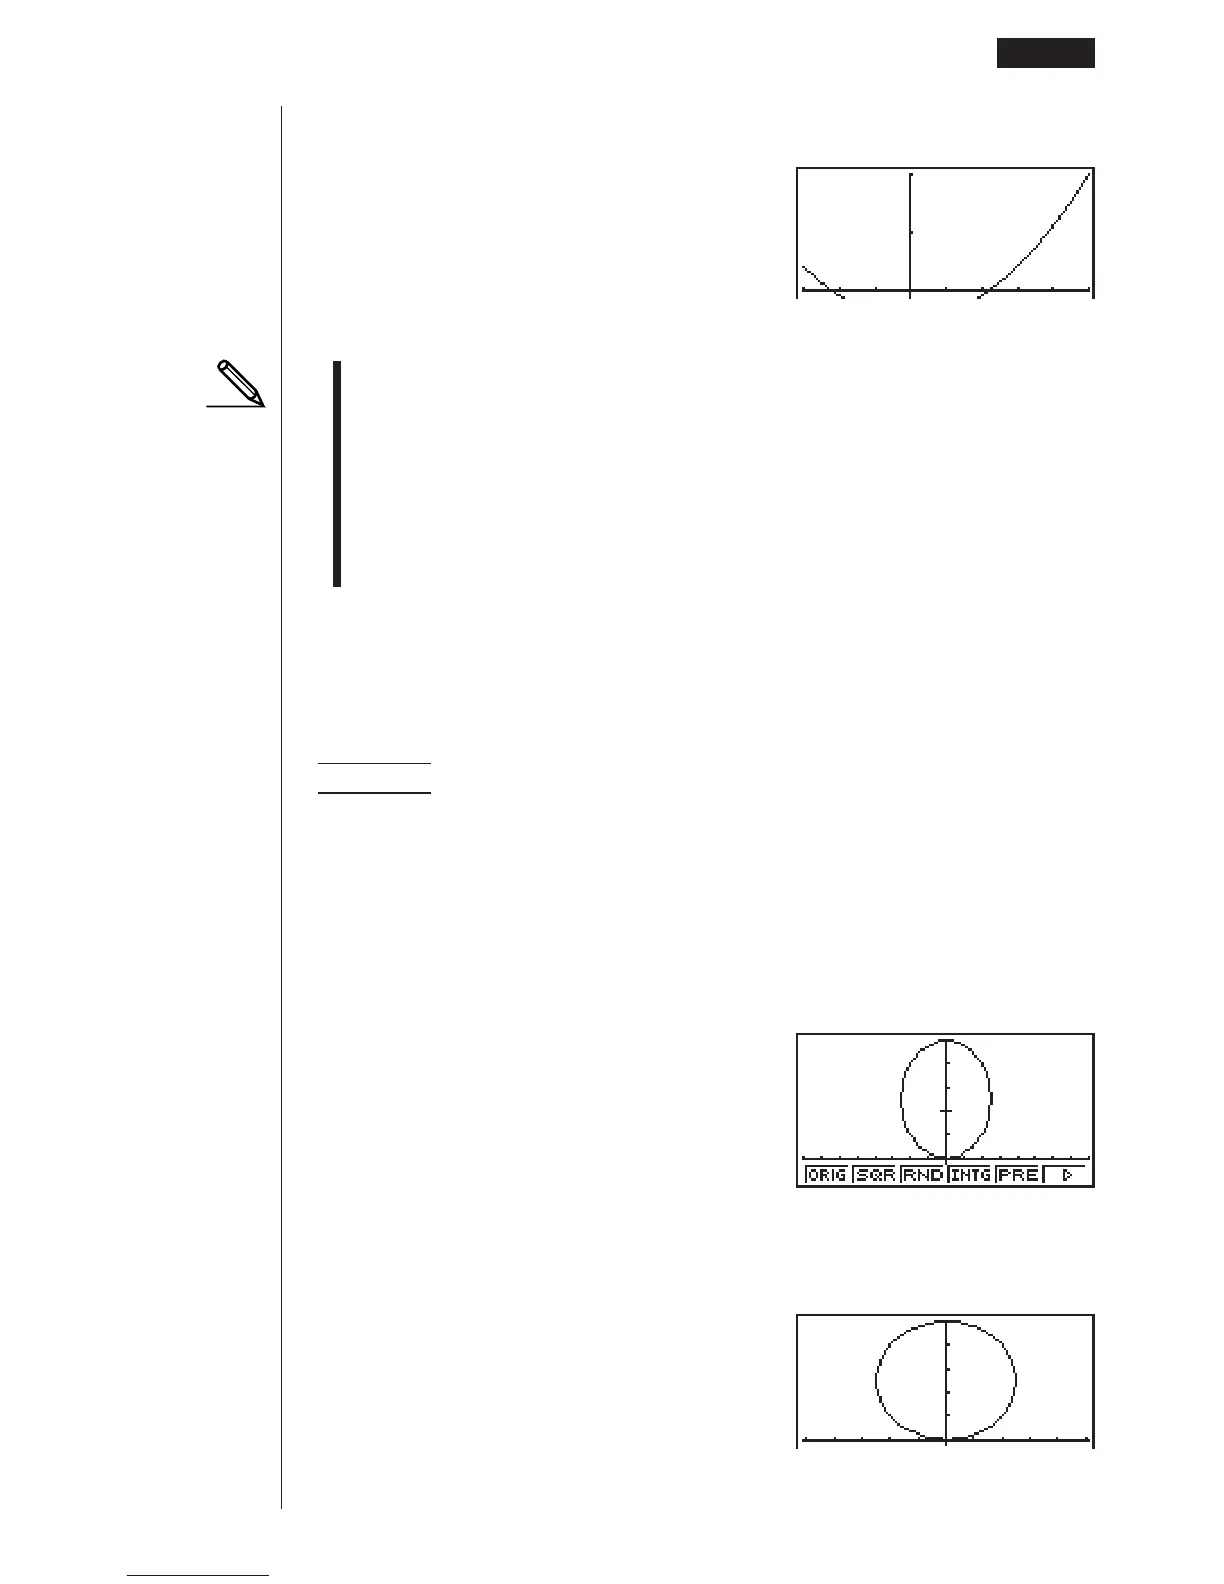
2. Press 2 (SQR) to make the graph a circle.
2(SQR)
1 2 3456
Other Graphing Functions 8 - 6
 Loading...