245
kk
kk
k Graphing a Function
uu
uu
uTo specify the draw/non-draw status of a formula
There are two options for the draw/non-draw status of a function graph.
• For the selected function only
• Overlay the graphs for all functions
To specify the draw/non-draw status, use same procedure as that for specifying
table generation/non-generation status.
uu
uu
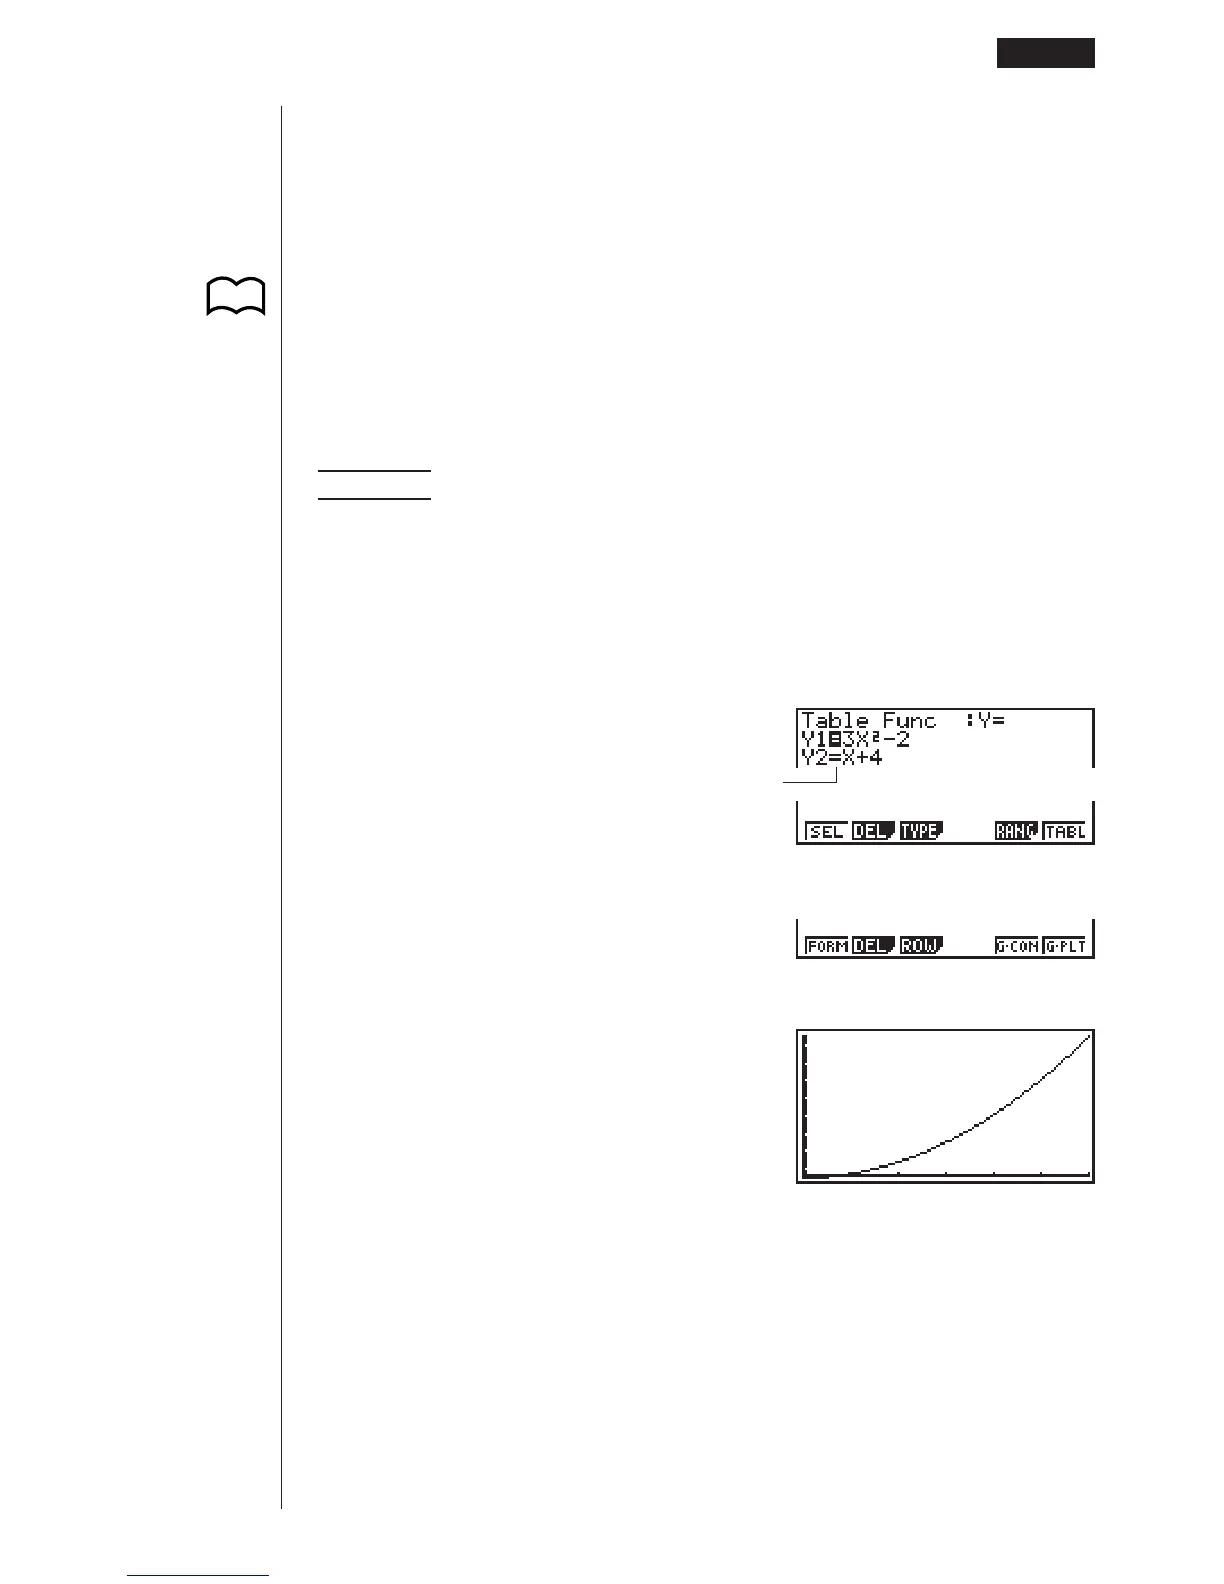
uTo graph only a selected function
Example To graph y = 3x
2
– 2, which is stored in memory area Y1, as a
connect type graph.
Use the following View Window parameters.
Xmin = 0 Ymin = –2
Xmax = 6 Ymax = 106
Xscale = 1 Yscale = 2
c1(SEL)
(Specifies graph non-draw.)
6(TABL)
5(G•CON)
(Specifies connect type graph.)
Editing Tables and Drawing Graphs 15 - 4
123456
12345 6
No highlighting
P.238
 Loading...