291
3 (List3) ....... List 3
4 (List4) ....... List 4
5 (List5) ....... List 5
6 (List6) ....... List 6
uu
uu
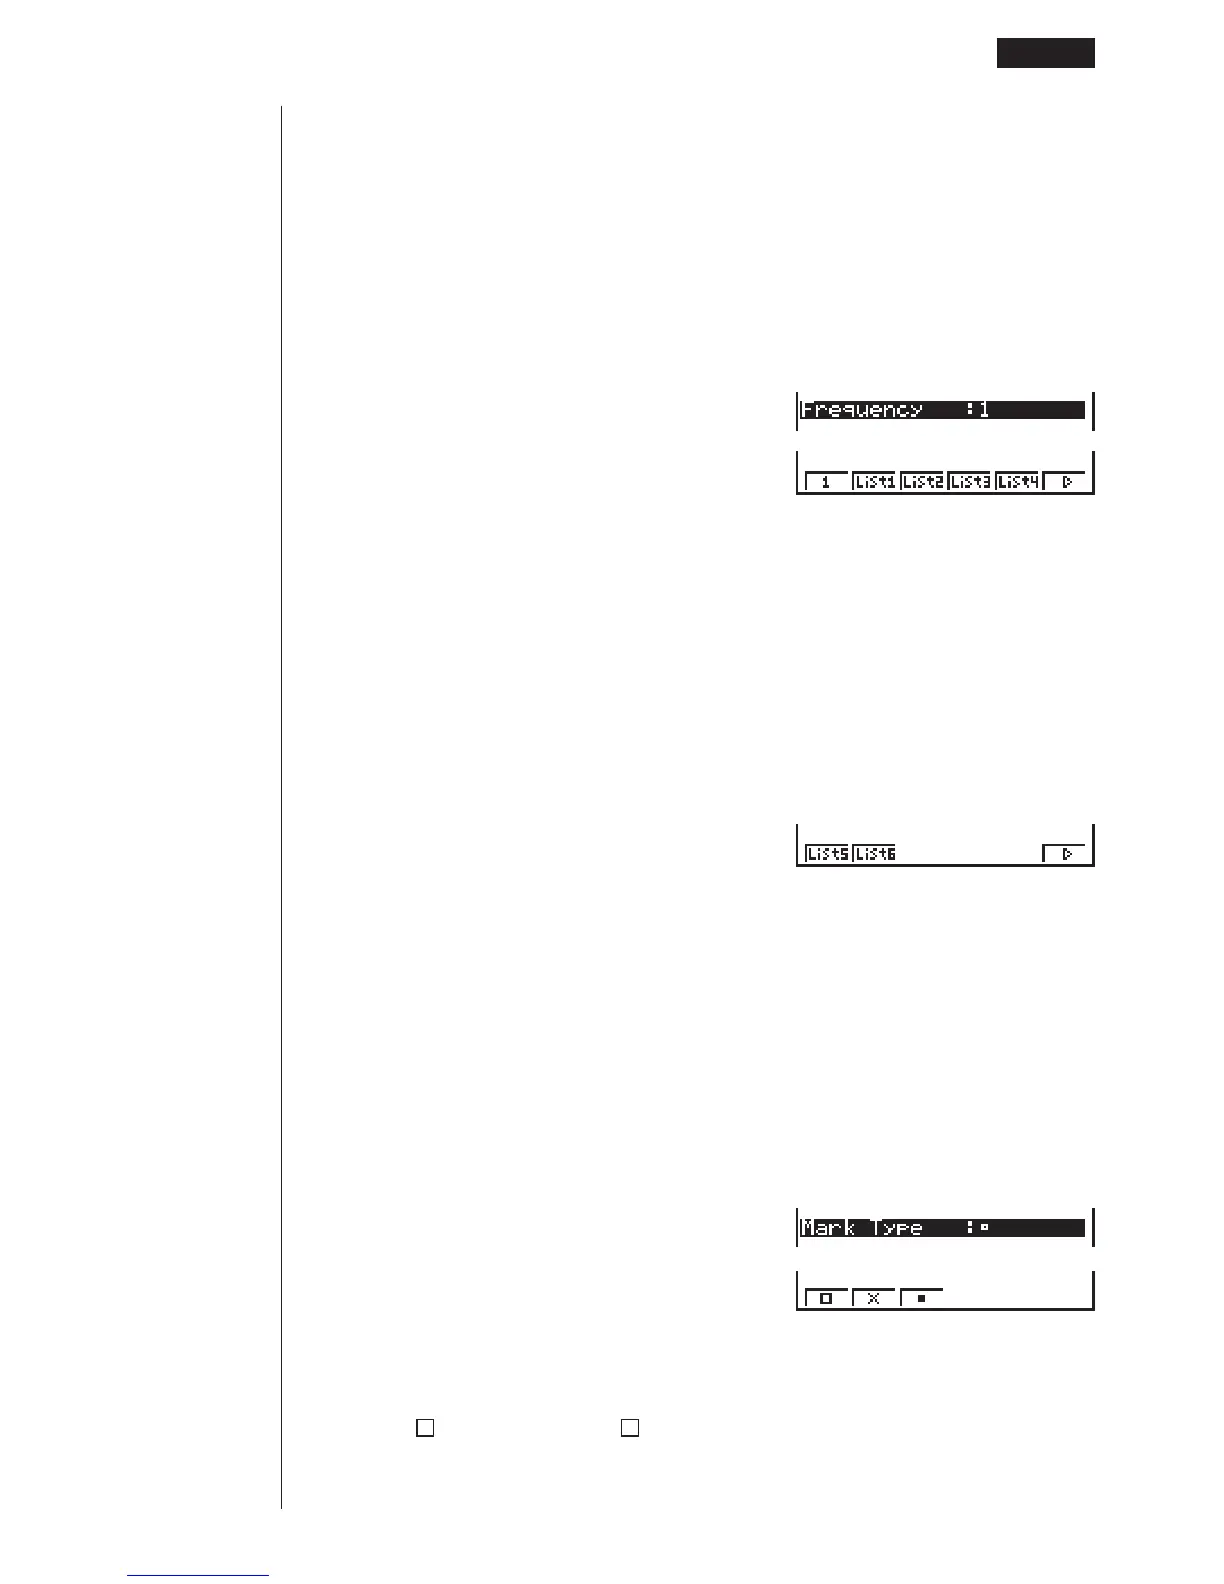
uTo select the frequency data list (Frequency)
1. While the general graph settings screen is on the display, use f and c to
move the highlighting to the Frequency item.
2. Use the function key menu to select the frequency setting you want.
1 (1) ............ Plot all data (1-to-1)
2 (List1) ....... List 1 data is frequency data.
3 (List2) ....... List 2 data is frequency data.
4 (List3) ....... List 3 data is frequency data.
5 (List4) ....... List 4 data is frequency data.
6 (g) ........... Next menu
6(g)
1 (List5) ....... List 5 data is frequency data.
2 (List6) ....... List 6 data is frequency data.
6 (g) ........... Previous menu
uu
uu
uTo select the plot mark type (Mark Type)
1. While the general graph settings screen is on the display, use f and c to
move the highlighting to the Mark Type item.
2. Use the function key menu to select the plot mark you want to select.
1 ( ) ........... Plot using
2 (X) ............ Plot using X
3 (•) ............. Plot using •
123456
123456
123456
Paired-Variable Statistical Calculation Examples 18 - 2
 Loading...