290
6(g)
1 (Log) ........ Logarithmic regression graph
2 (Exp) ........ Exponential regression graph
3 (Pwr) ........ Power regression graph
6 (g) ........... Previous menu
uu
uu
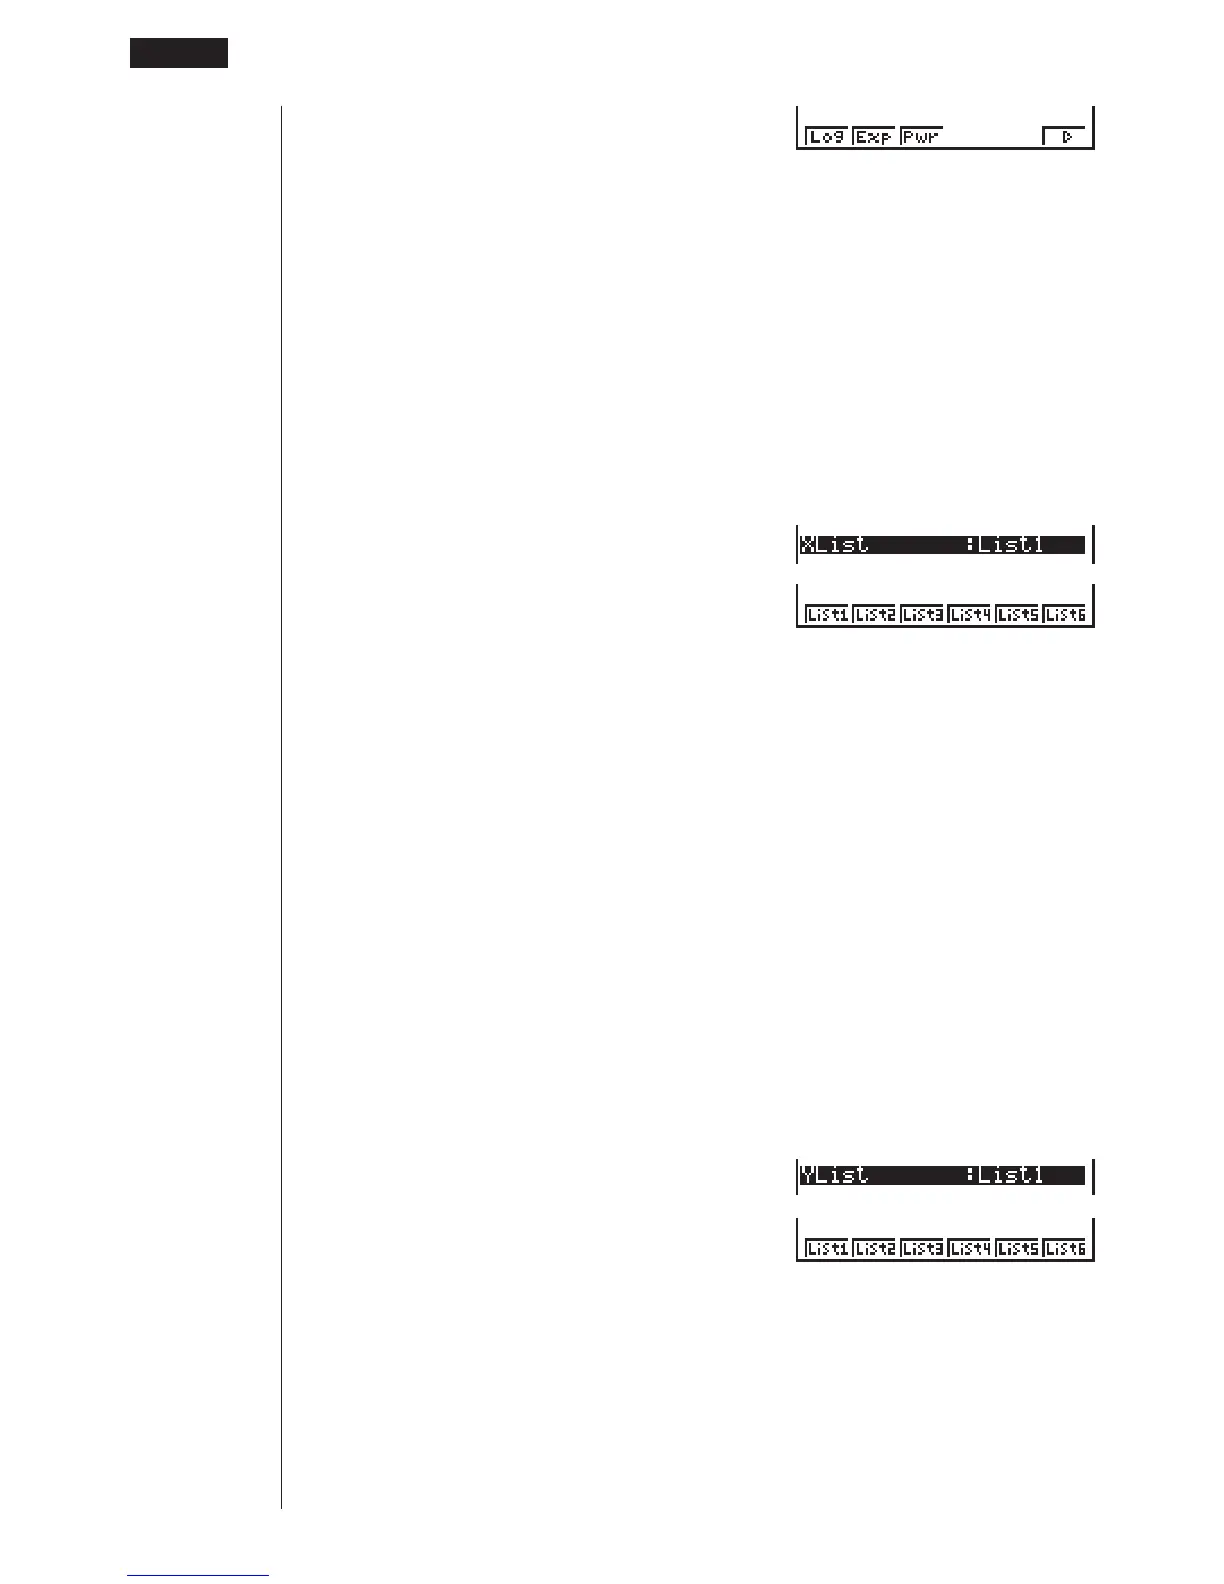
uTo select the x-axis data list (XList)
1. While the graph settings screen is on the display, use f and c to move the
highlighting to the XList item.
2. Use the function key menu to select the name of the statistical data list whose
values you want on the x-axis of the graph.
1 (List1) ....... List 1
2 (List2) ....... List 2
3 (List3) ....... List 3
4 (List4) ....... List 4
5 (List5) ....... List 5
6 (List6) ....... List 6
uu
uu
uTo select the y-axis data list (YList)
1. While the graph settings screen is on the display, use f and c to move the
highlighting to the YList item.
2. Use the function key menu to select the name of the statistical data list whose
values you want on the y-axis of the graph.
1 (List1) ....... List 1
2 (List2) ....... List 2
123456
123456
123456
18 - 2 Paired-Variable Statistical Calculation Examples
 Loading...