289
2. Use the function key menu to select the StatGraph area you want to select.
1 (GPH1) ..... Graph 1
2 (GPH2) ..... Graph 2
3 (GPH3) ..... Graph 3
uu
uu
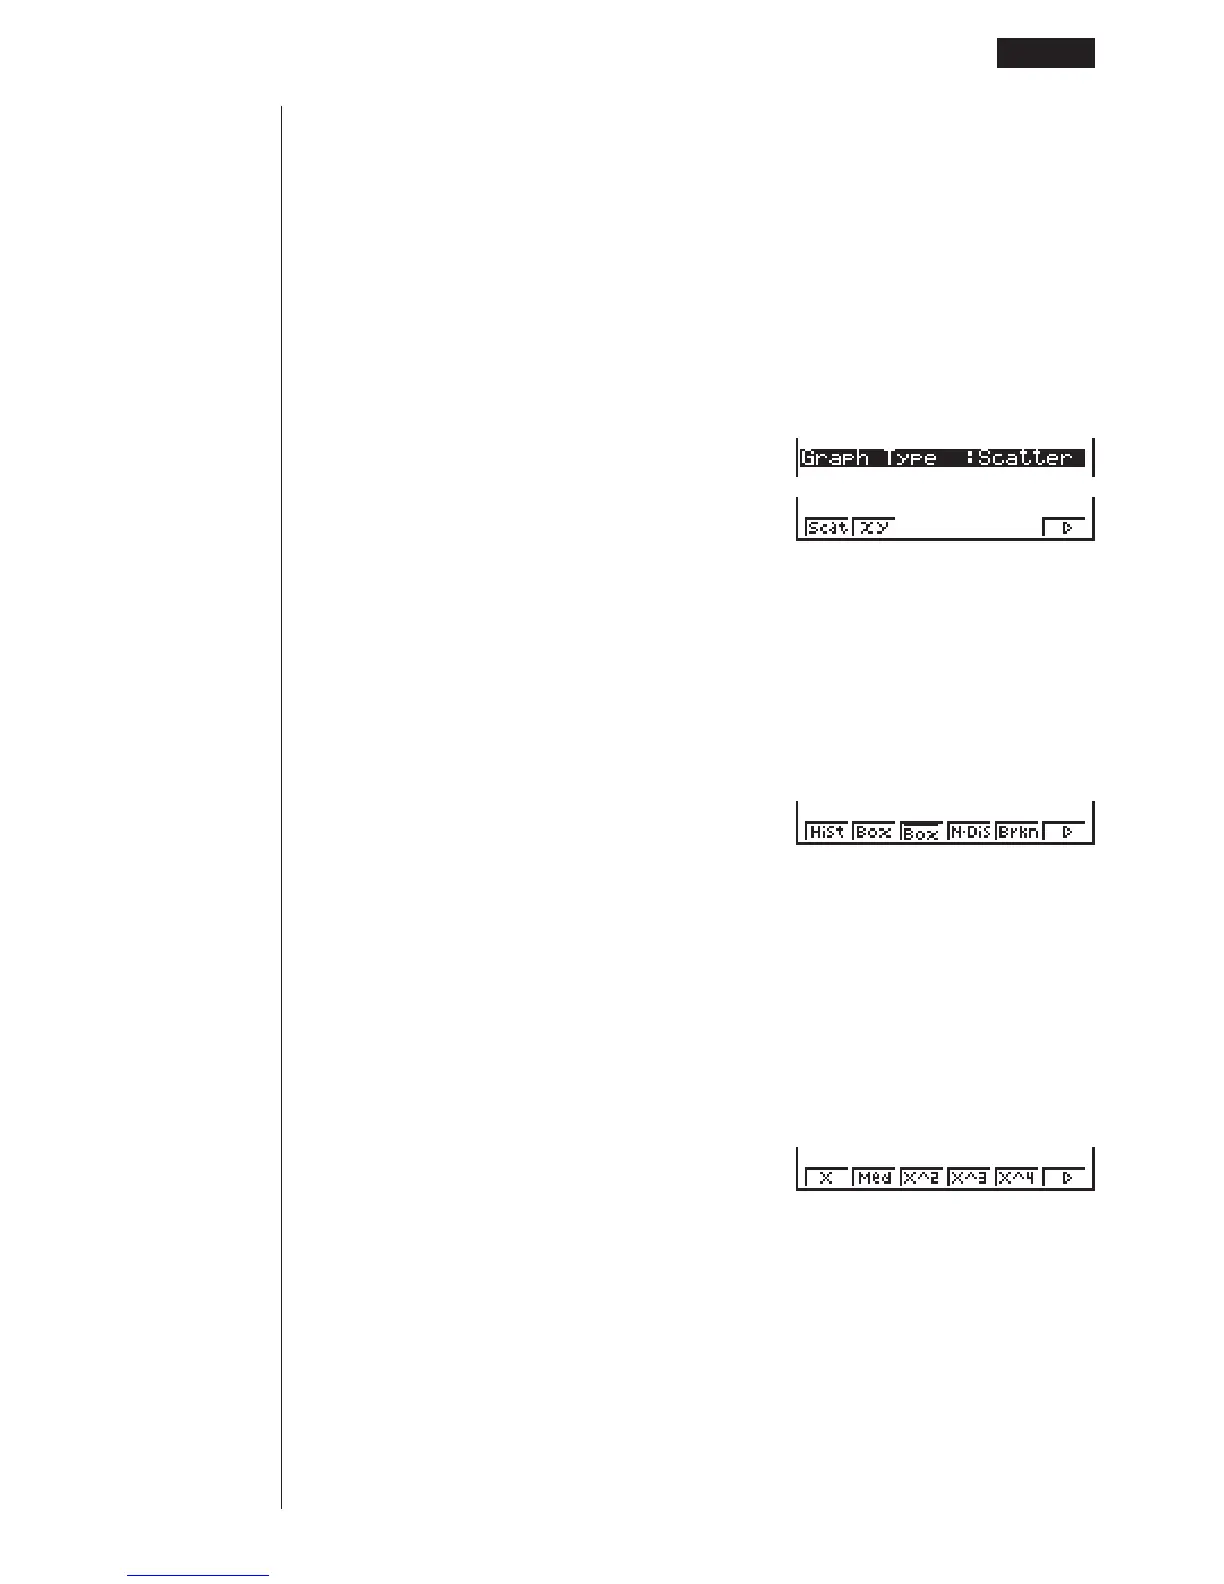
uTo select the graph type (Graph Type)
1. While the general graph settings screen is on the display, use f and c to
move the highlighting to the Graph Type item.
2. Use the function key menu to select the graph type you want to select.
1 (Scat) ....... Scatter diagram
2 (
xy) ........... xy line graph
6 (g) ........... Next menu
6(g)
1 (Hist) ........ Histogram (bar graph)
2 (Box) ........ Med-box graph
___
3 (Box) ........ Mean-box graph
4 (N•Dis) ..... Normal distribution curve
5 (Brkn) ....... Line graph
6 (g) ........... Next menu
6(g)
1 (X) ............ Linear regression graph
2 (Med) ....... Med-Med graph
3 (X^2) ........ Quadratic regression graph
4 (X^3) ........ Cubic regression graph
5 (X^4) ........ Quartic regression graph
6 (g) ........... Next menu
123456
123456
123456
Paired-Variable Statistical Calculation Examples 18 - 2
 Loading...