146
8-6 Other Graphing Functions
The functions described in this section tell you how to read the x- and y-coordinates
at a given point, and how to zoom in and zoom out on a graph.
• These functions can be used with rectangular coordinate, polar coordinate, para-
metric, X = constant, and inequality graphs only.
kk
kk
k Connect Type and Plot Type Graphs (Draw Type)
You can use the Draw Type setting of the set-up screen to specify one of two graph
types.
• Connect
Points are plotted and connected by lines to create a curve.
• Plot
Points are plotted without being connected.
kk
kk
k Trace
With trace, you can move a flashing pointer along a graph with the f, c, d, and
e cursor keys and obtain readouts of coordinates at each point. The following
shows the different types of coordinate readouts produced by trace.
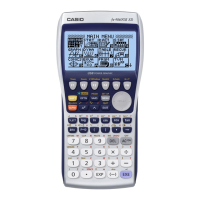
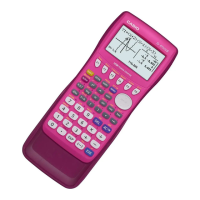
• Rectangular Coordinate Graph • Polar Coordinate Graph
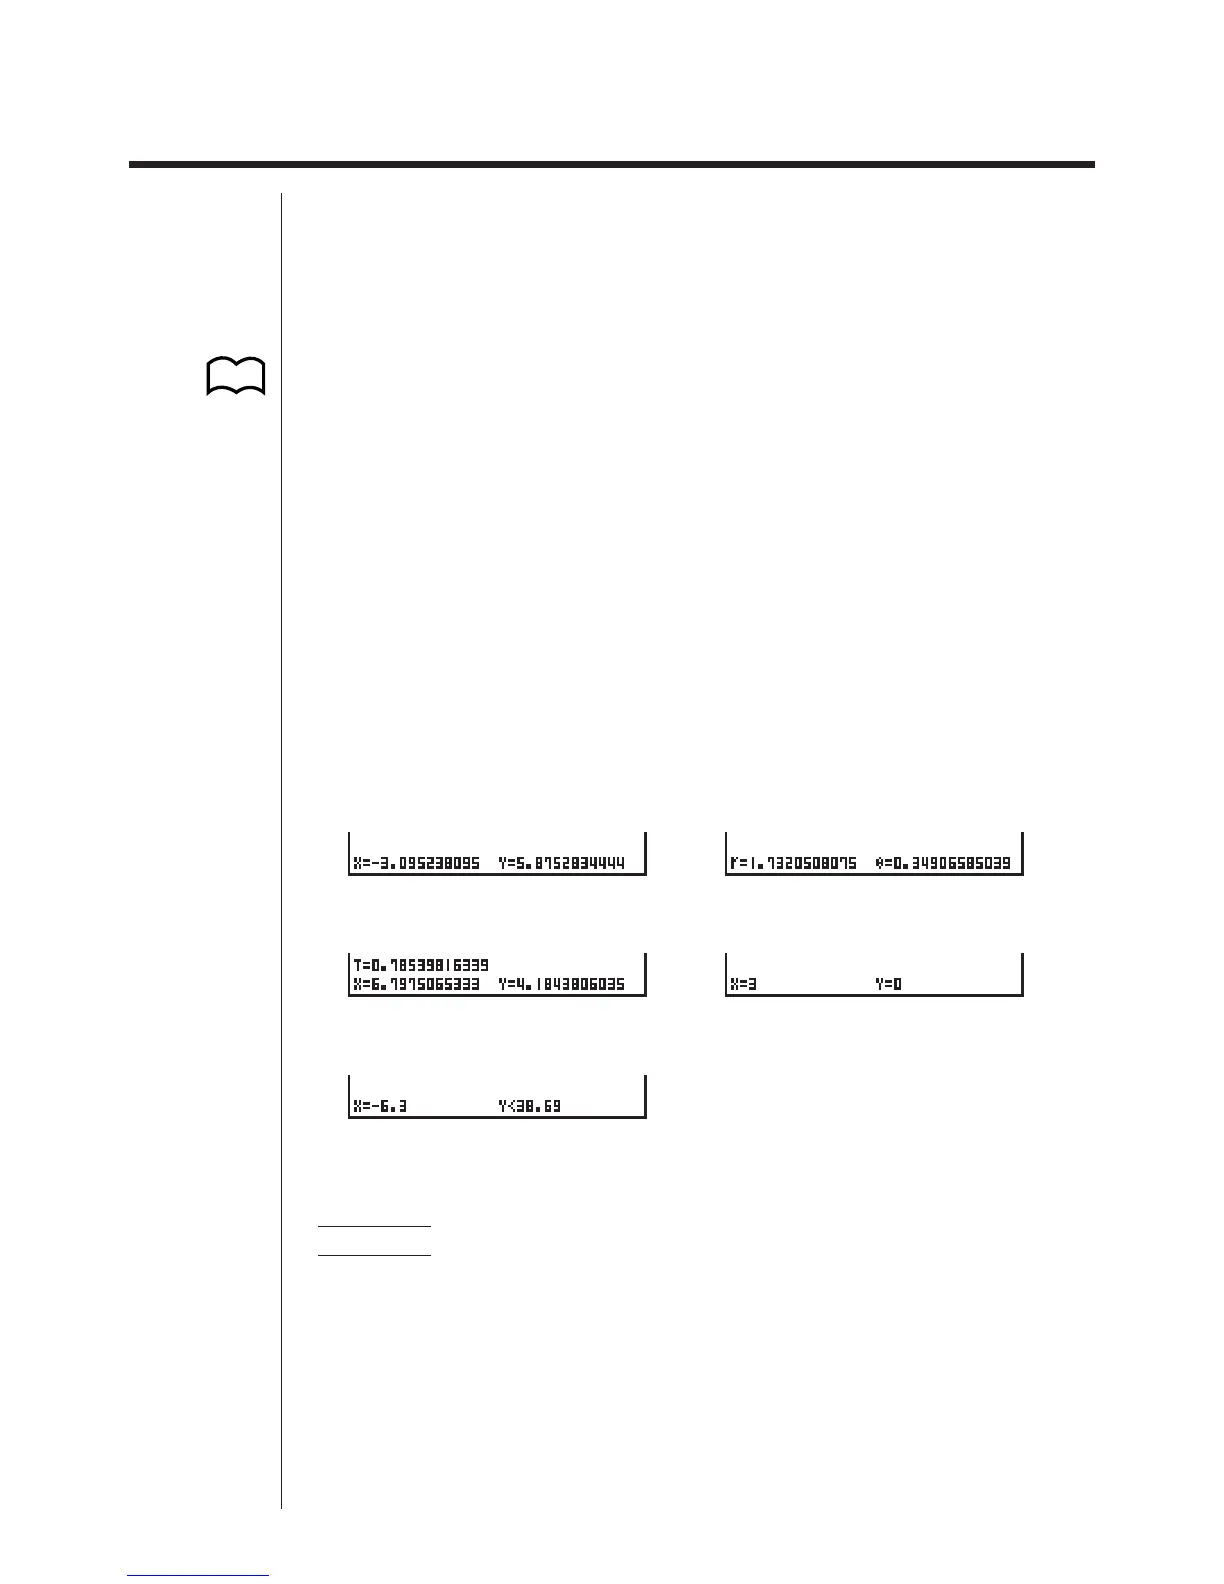
• Parametric Function Graph • X = Constant Graph
• Inequality Graph
uu
uu
uTo use trace to read coordinates
Example To determine the points of intersection for graphs produced by
the following functions:
Y1 = x
2
– 3
Y2 = –x + 2
Use the following View Window parameters.
Xmin = –5 Ymin = –10
Xmax = 5 Ymax = 10
Xscale = 1 Yscale = 2
P.6
 Loading...