Section 3: Onsite Analysis - Measurement Menu
56
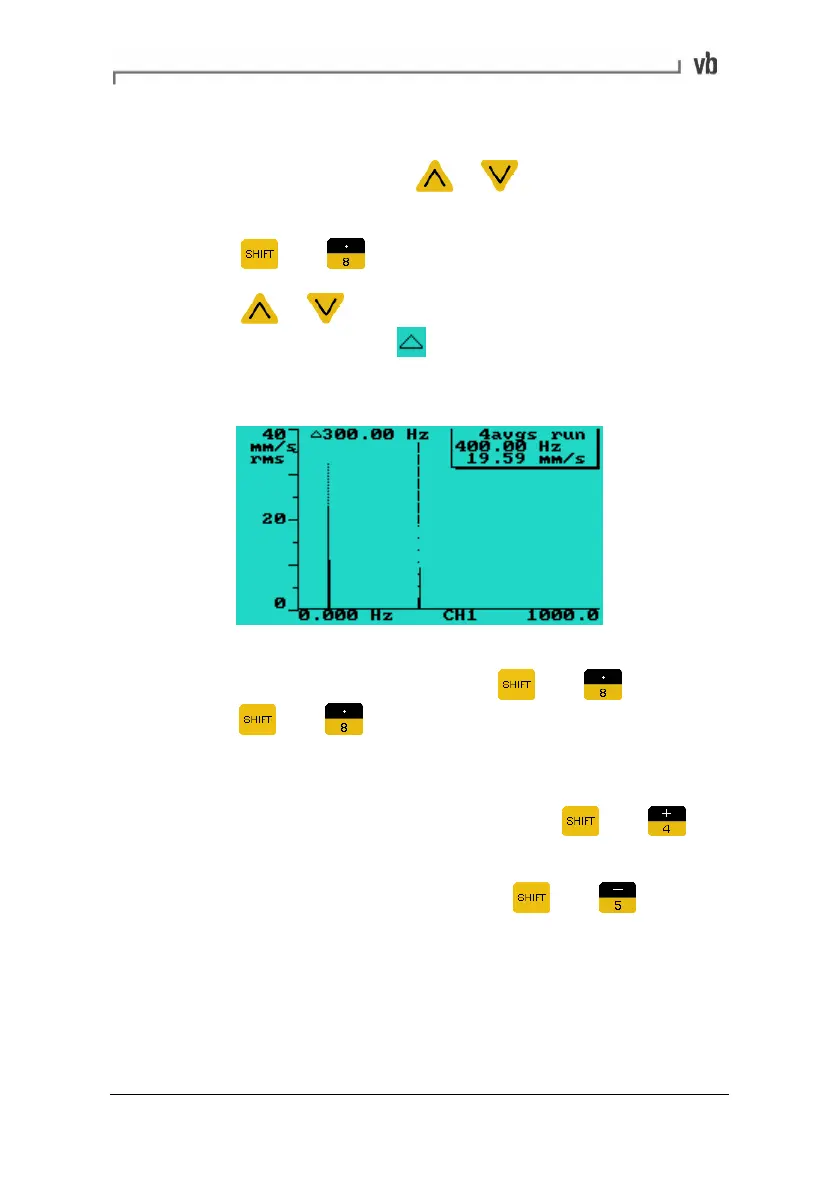
Displaying frequency/time difference between peaks
• To display the frequency difference or time difference
between two peaks press
or to position the main
cursor at one of the peaks.
• Press
then to anchor a datum cursor at the peak.
• Press
or to position the main cursor at the other
peak. The delta symbol
appears beside a value
indicating the frequency or time difference between the two
peaks.
• To clear the datum cursor move the main cursor to where
the datum cursor is and then press
then again (or
press
then twice if not on the datum cursor).
Zooming
• To take a close-up view of a spectrum or waveform move the
cursor to the position of interest and press
then to
zoom in by a factor of 2.
• To zoom out (by a factor of 2), press
then .
The more spectral lines or the more waveform sample points used,
the more times you can zoom. Moving the cursor to the edge of the
screen within zoomed views will pan the viewing area across the
spectrum or waveform by up to 50% of the viewing area.
Artisan Technology Group - Quality Instrumentation ... Guaranteed | (888) 88-SOURCE | www.artisantg.com
 Loading...