S E T U P F O R M C H A P T E R 4
Display Tab
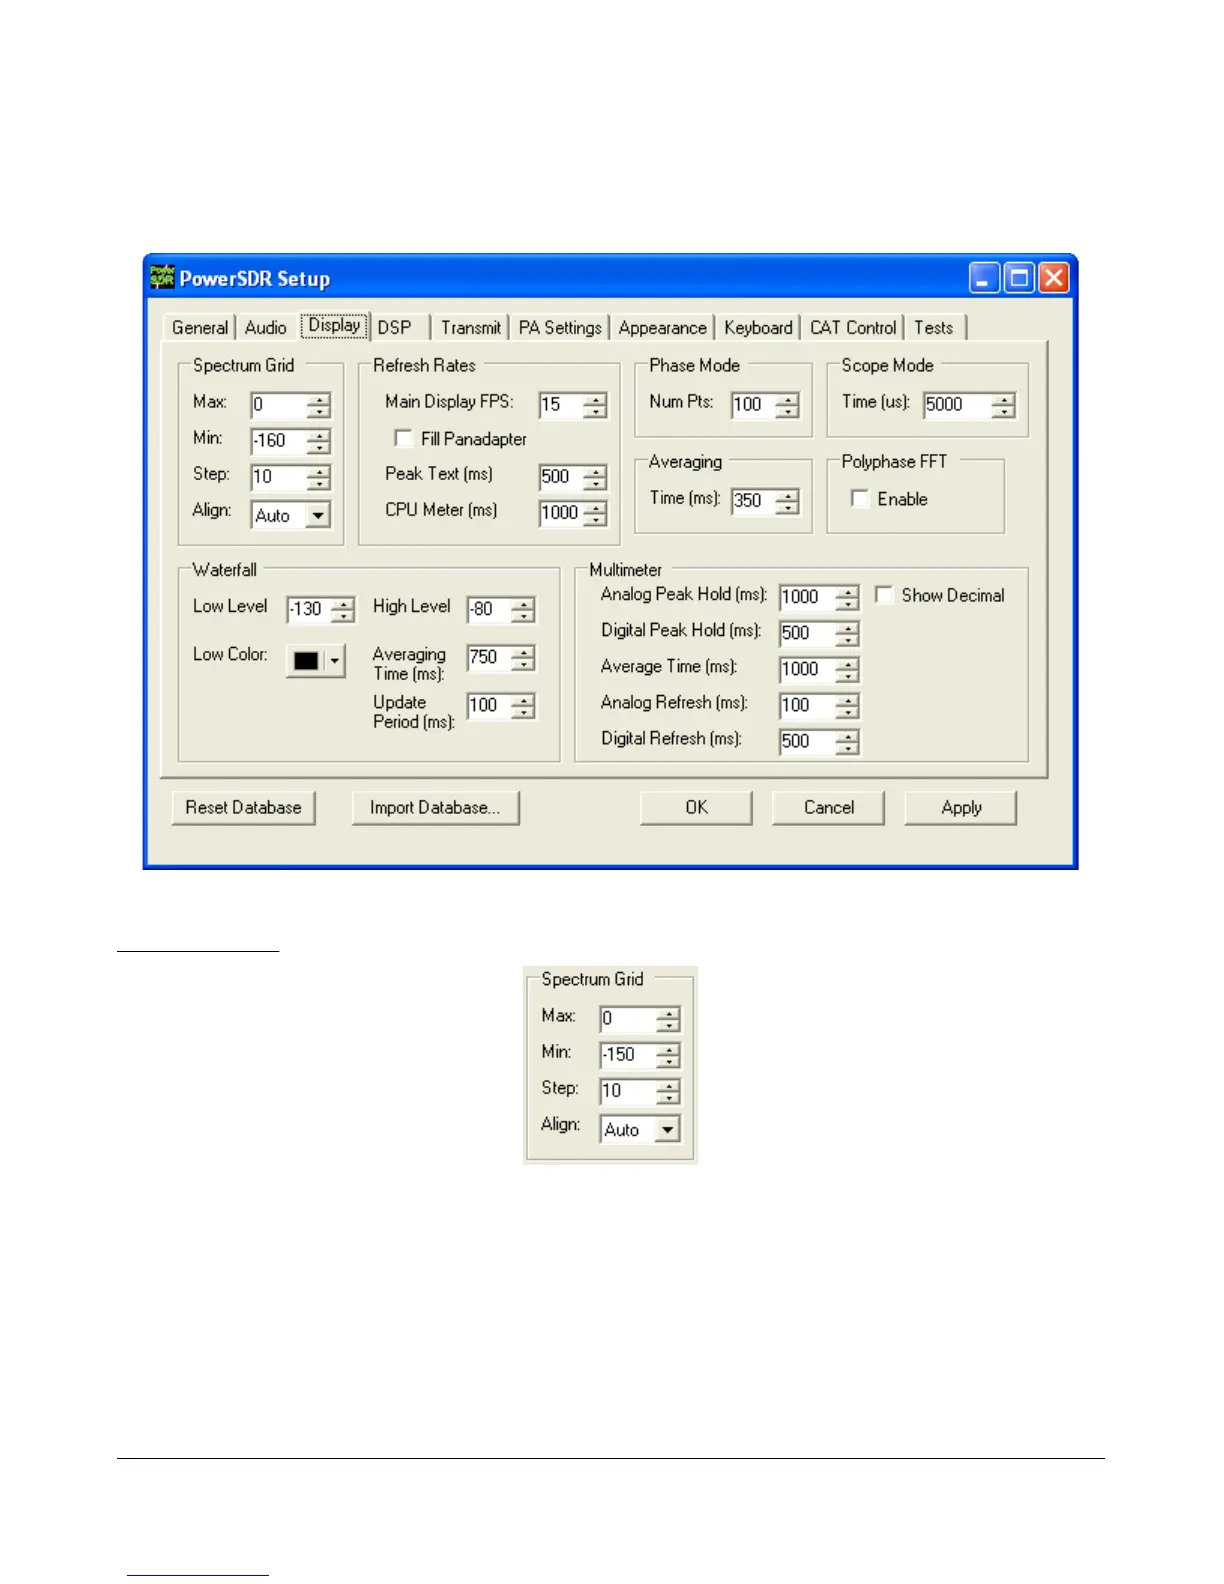
Figure 75: Setup Form - Display Tab
Spectrum Grid
Figure 76: Spectrum Grid
The spectrum grid controls define the range and scale of the vertical axis (signal level in dBm) shown in
the Spectrum, Histogram, and Panadapter displays.
Max: The maximum displayed signal level in dBm (i.e. top of the display).
Min: The minimum displayed signal level in dBm (i.e. bottom of the display).
Step: Spacing between the horizontal grid lines in dBm.
76 2003-2009 FlexRadio Systems
 Loading...