EasyManuals Logo
Home>HP>Measuring Instruments>1630D

HP 1630D User Manual

HP 1630D
183 pages
To Next Page IconTo Next Page
To Previous Page IconTo Previous Page
Page #72 background imageLoading...
Page #72 background image
Performance
Analysis
Measurements

Model
1630A/D/G
5-4
StateLabel
Overview
Chart
------------------------------------
Total
samples
26152

those
not
in
arty
Pange
Psnge

Program
Activity
Histogram
of
ROGP
FAUCI
FcJJB
Fl11JL
FOIV
FCl1P
FMfiVE
FI10Pfl
14
:<
1V7
:
2
"
1
y-`
25
.,
e0
. " :
0
10
20
30 40 `0 60
-
0
60
40
100
Percent
.sge
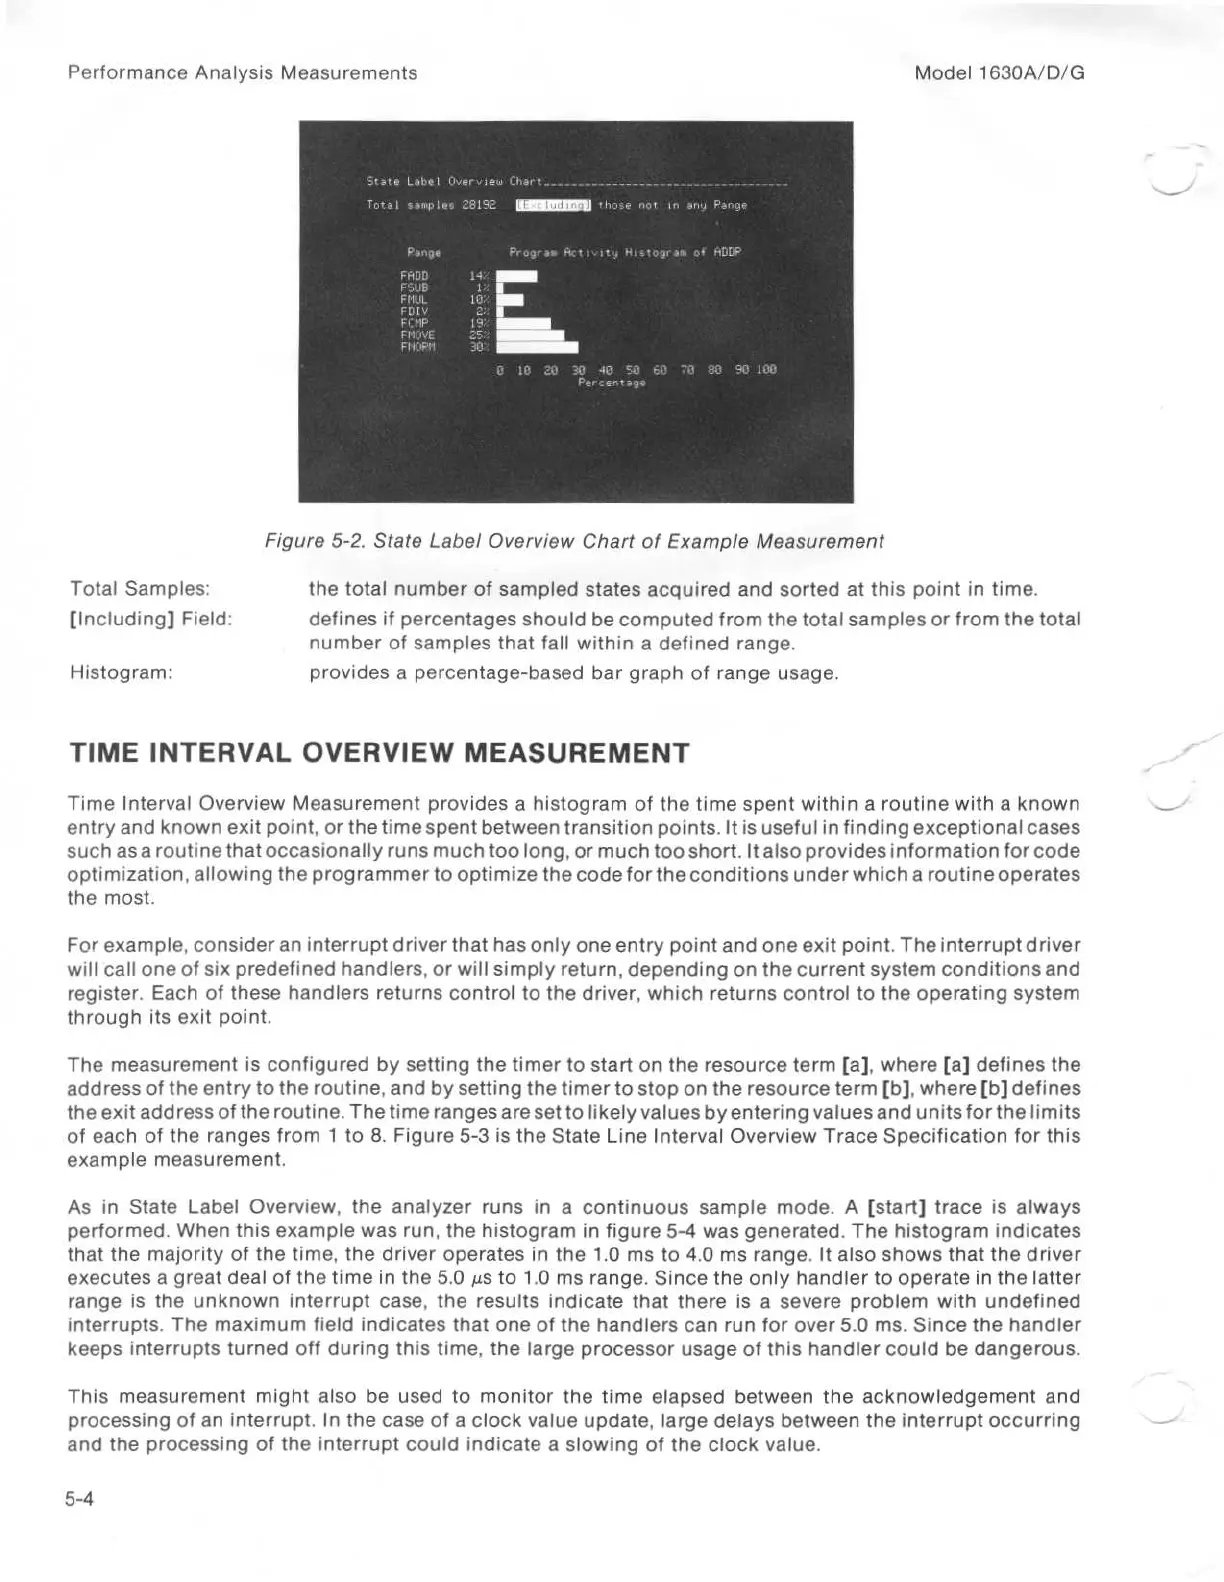
Figure
5-2
.
State
Label
Overview
Chart
of
Example
Measurement
Total
Samples
:

the
total
number
of
sampled
states
acquired
and
sorted
at this
point
in
time
.
[Including]
Field
:

defines
if
percentages
should
be
computed
from
the
total
samples
or
from
the
total
number
of
samples
that
fall
within a
defined
range
.
Histogram
:

provides
a
percentage-basedbar
graph
of
range
usage
.
TIME
INTERVAL
OVERVIEW
MEASUREMENT
Time
Interval
Overview
Measurement
provides
a
histogram
of
the
time
spent
within a
routine
with
a
known
entry
and
known
exit
point,
or the
time
spent
between
transition
points
.
It is
useful
in
finding
exceptional
cases
such
as
a
routine
that
occasionally
runs
much
too
long,
or
much
too
short
.
It
also
provides
information
for
code
optimization,
allowing
the
programmer
to
optimize
the
code
for
the
conditions
under
which
a
routine
operates
the
most
.
For
example,
consider
an
interrupt
driver
that
has
only
one
entry
point
andone
exit
point
.
The
interruptdriver
will call
one
of
six
predefined
handlers,
or
will
simply
return,
depending
on
the
current
system
conditions
and
register
.
Each
of
these
handlers
returns control
to
the
driver,
which
returns
control
to
the
operating
system
through
its
exit
point
.
The
measurement
is
configured
by
setting
the
timer
to
start
on
the
resourceterm
[a],
where
[a]
defines
the
address
of
the
entry
to
the
routine,
and
by
setting
the
timer
to
stop
on
the
resource
term
[b],
where
[b]
defines
the
exit
address
of
the
routine
.
The
time
ranges
areset
to
likely
values
by
entering
values
and
units
for
the
limits
of
each
of
the
ranges
from
1
to
8
.
Figure5-3
is
the
State
Line
Interval
Overview
Trace
Specification
for
this
example
measurement
.
As
in
State Label
Overview,
the
analyzer
runs
in
a
continuous
sample
mode
.
A
[start]
trace
is
always
performed
.
When
this
example
was
run,
the
histogram
in
figure
5-4
was
generated
.
The
histogram
indicates
that
the
majority
of
the
time,
the
driver
operates
in
the
1
.0
ms
to
4
.0
ms
range
.
It
also
shows
that
the
driver
executes
a
great
deal
of
the
time
in
the
5
.0
/us
to
1
.0
ms
range
.
Since
the
only
handler
to
operate
in
the
latter
range
is
the
unknown
interrupt
case,
the
results
indicate that
there
is
a
severe
problem
with
undefined
interrupts
.
The
maximum
field
indicates
that
one
of
the
handlers
can
run
for
over
5
.0
ms
.
Since
the
handler
keeps
interrupts
turned
off
during
this
time,
the
large
processor
usage
of this
handler
could
be
dangerous
.
This
measurement
might
also
be
used
to
monitor
the
time
elapsed
between
the
acknowledgement
and
processing
of
an
interrupt
.
In
the
case
of
a
clockvalue
update,
large
delays
between
the
interrupt
occurring
and
the
processing
of
the
interrupt
could
indicate a
slowing
of
the
clockvalue
.

Table of Contents

Other manuals for HP 1630D

Questions and Answers:

Question and Answer IconNeed help?

Do you have a question about the HP 1630D and is the answer not in the manual?

HP 1630D Specifications

General IconGeneral
BrandHP
Model1630D
CategoryMeasuring Instruments
LanguageEnglish

Related product manuals