EasyManuals Logo
Home>HP>Measuring Instruments>1630D

HP 1630D User Manual

HP 1630D
183 pages
To Next Page IconTo Next Page
To Previous Page IconTo Previous Page
Page #74 background imageLoading...
Page #74 background image
Performance
Analysis
Measurements
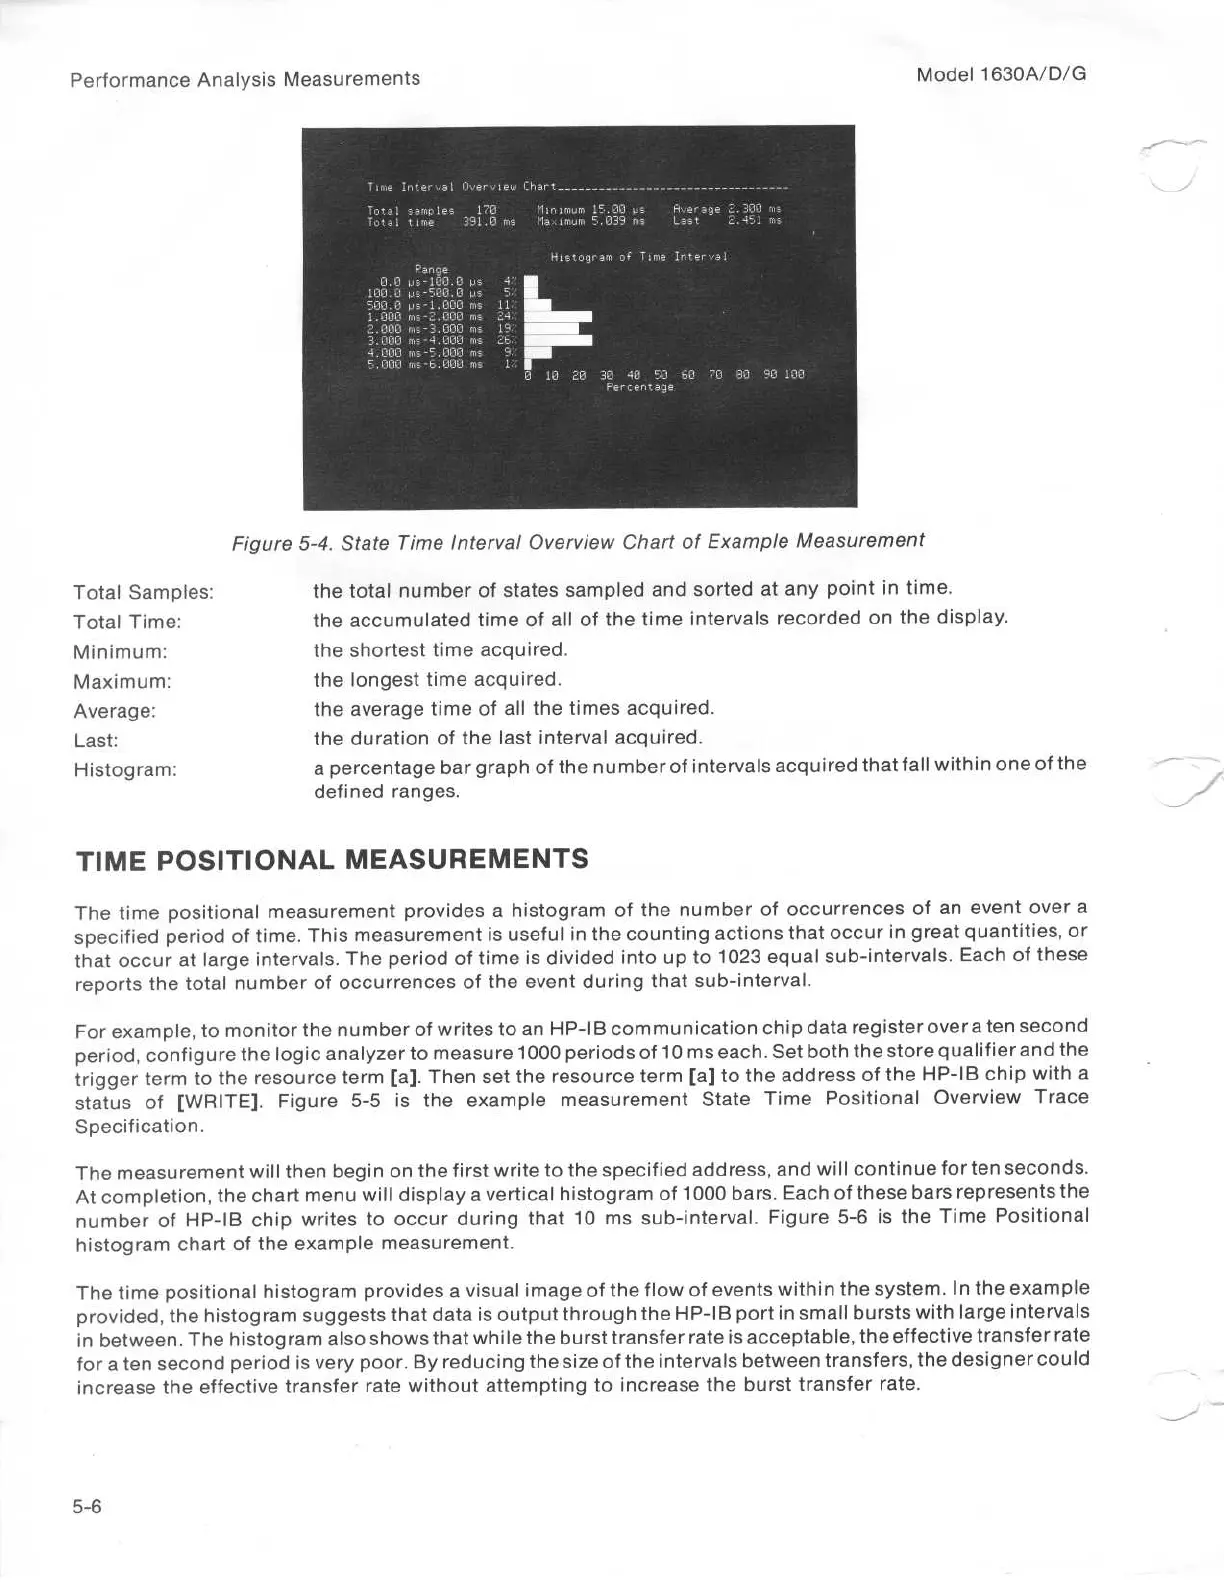
Total
Samples
:
Total
Time
:
Minimum
:
Maximum
:
Average
:
Last
:
Histogram
:
Time
Interval)-
vieai
Chart
._____---___________-_____-----____
Total

-Temples

170

Minimum

15
.00

ps

flv-o
-
age

300

r~~s
e
Tat
al

time

391
.0

rris

Me_
im'm
5
.03'3

ms

Last

2
.451

mis
Page
0 .0
us-100
.0 Ps
100
.0
e
.-500
.0
I
's
500
.0 us.-1
.000 ms
1
.000
nr-
.-2
.000 ms
2
.000
ms-3
.000
rris
7
.000
me--4
.000 ms
4
.0010
ms-5
.1300
ms
5
.000m=-G
.000 ms
Histogram
of
Time
Interval
0
10 20 30 40
50
E0 70 80 90
100
Percentage
Figure
5-4
.
State
Time
Interval
Overview
Chart
of
Example
Measurement
defined
ranges
.
TIME
POSITIONAL
MEASUREMENTS
Model
1630A/D/G
the
total
number
of
states
sampled
and
sorted
at
any
point
in
time
.
the
accumulated
time
of
all
of
the
time
intervals
recorded
on
the
display
.
the
shortest time
acquired
.
the
longest
timeacquired
.
the
average
time
of
all
the
times
acquired
.
the
duration
of
the
last
interval
acquired
.
a
percentage
bar
graph
of
the
numberof
intervals
acquired
thatfall
within
one
of
the
The
time
positional
measurement
provides
a
histogram
of
the
number
of
occurrences
of
an
event
over
a
specified
period
of
time
.
This
measurement
is
useful
in
the
counting
actions
that
occur
in
great
quantities,
or
that
occur
at
large
intervals
.
The
period
of
time
is
divided
into
up
to
1023
equal
sub-intervals
.
Each
of
these
reports
the
total
number
of
occurrences
of
the
event
during
that
sub-interval
.
For
example,
to
monitor
the
number
of
writes
to
an
HP-IB
communication
chip
data
registerovera
ten
second
period,
configure
the
logic
analyzer
to
measure
1000
periods
of
10
ms
each
.
Set
both
the
store
qualifier
and
the
trigger
term
to
the
resource
term
[a]
.
Then
setthe
resource
term
[a]
to
the
address
of
the
HP-IB
chip with
a
status
of
[WRITE]
.
Figure 5-5
is
the
example
measurement
State
Time
Positional
Overview
Trace
Specification
.
The
measurement
will
then
begin
on
the
first
write
to
the
specified
address,
and
will
continue
forten
seconds
.
At
completion,
the
chart
menu
will
display
a
vertical
histogram
of
1000
bars
.
Each
of
these
bars
represents
the
number
of HP-113
chip
writes to
occur
during
that 10
ms
sub-interval
.
Figure 5-6
is
the
Time
Positional
histogram
chart
of
the
example
measurement
.
The
time
positional
histogram
provides
a
visual
image
of
the
flow
of
events
within
the
system
.
In
the
example
provided,
the
histogram
suggests
that
data
is
output
through
the
HP-IB
port
in
small
bursts
with
large
intervals
in
between
.
The
histogram
also
shows
that
while
the
burst
transfer
rate
is
acceptable,
the
effective
transfer
rate
for
a
ten
second
period
is
very
poor
.
By
reducing
the
size
of
the
intervals
between
transfers,
the
designercould
increase
the
effective
transfer
rate
without
attempting
to
increase
the
burst
transfer
rate
.

Table of Contents

Other manuals for HP 1630D

Questions and Answers:

Question and Answer IconNeed help?

Do you have a question about the HP 1630D and is the answer not in the manual?

HP 1630D Specifications

General IconGeneral
BrandHP
Model1630D
CategoryMeasuring Instruments
LanguageEnglish

Related product manuals