8.6.4 SWR sweep
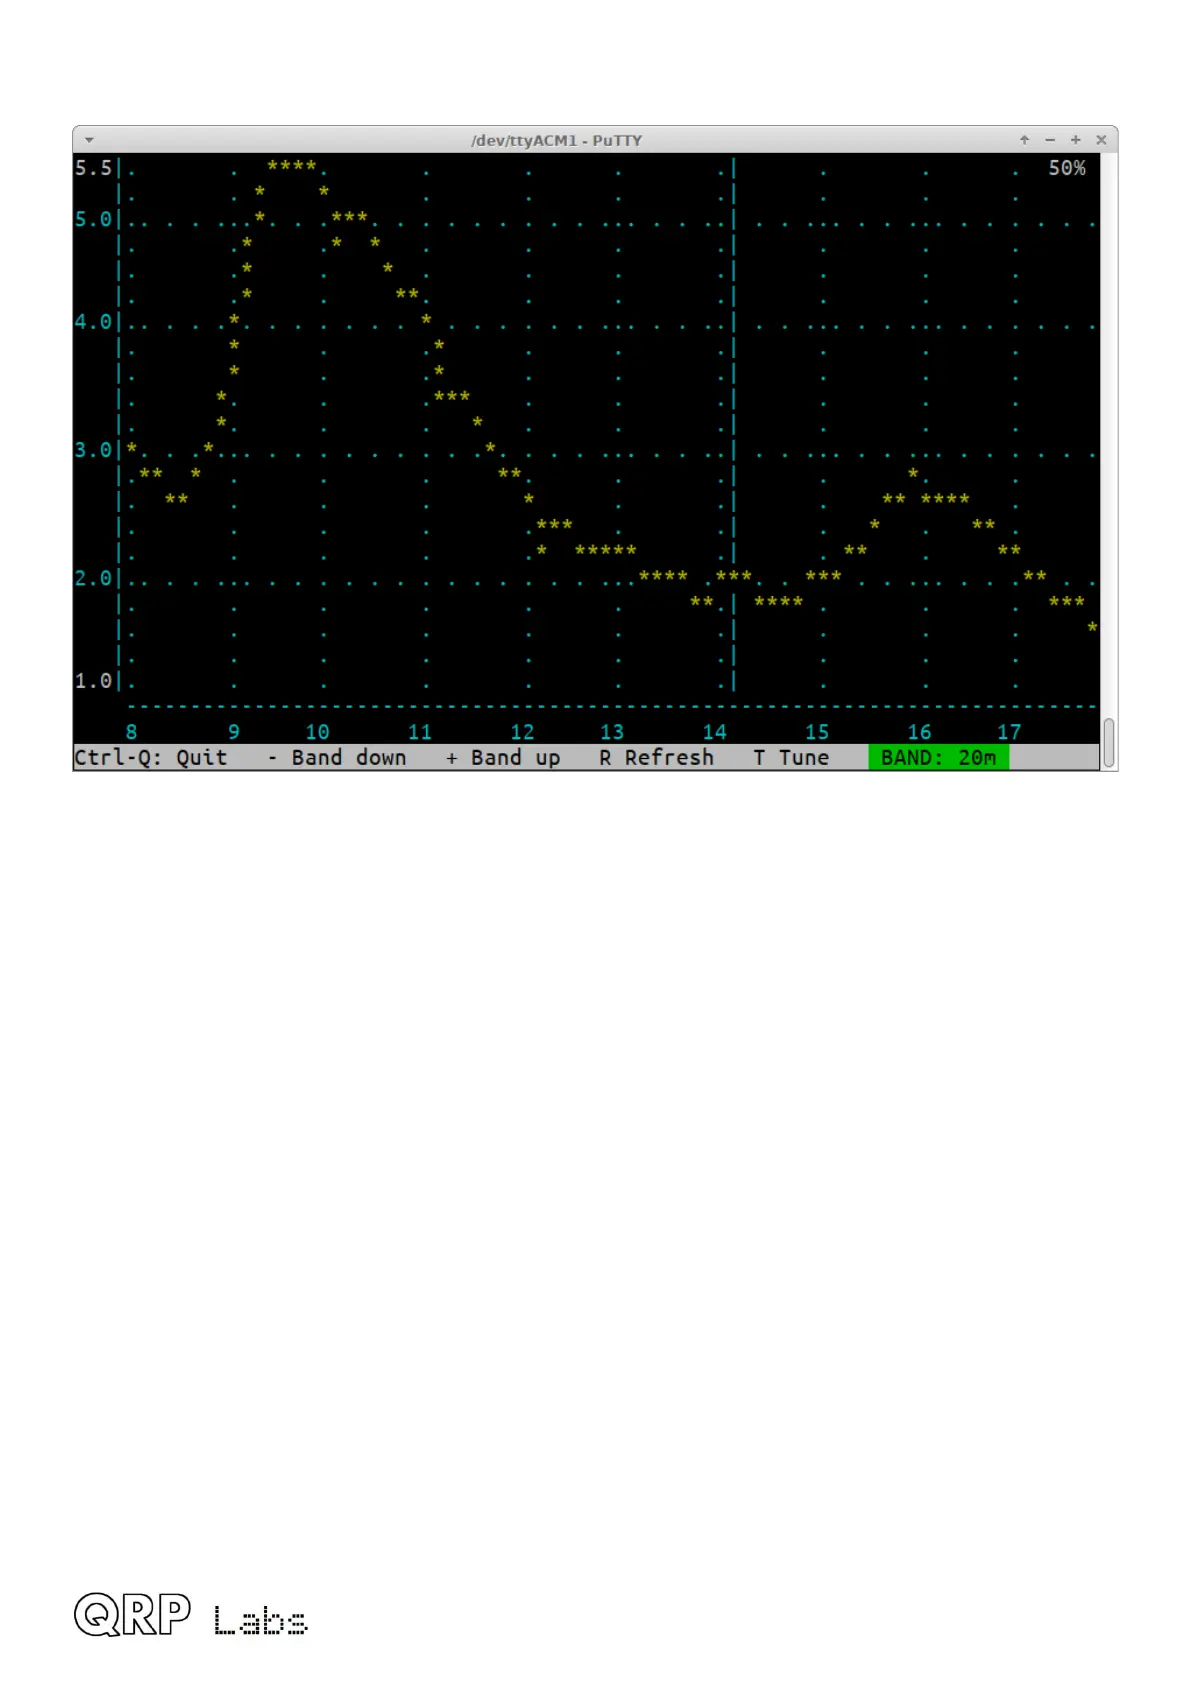
The SWR sweep tool has the same frequency range as the RF sweep tool; it displays the
measured SWR at each frequency. During the sweep the PA voltage is set to a proportion of full
power voltage determined by the “Tune %” parameter in the Protection menu. Remember that due
to the square-law relationship between voltage and power, when the voltage is halved the power
output is one quarter of full power. If the power is too low, the SWR measurement will be
inaccurate. If the power is too high, then during high SWR parts of the curve, stress may be placed
on the PA transistors. The PA voltage percentage is displayed in the top right corner of the screen.
The vertical axis shows the measured SWR level. Gridlines axis are displayed in blue. Vertical
gridlines are every 1 SWR, and horizontal axis gridlines as appropriate to the band. Gridline labels
are displayed in blue; the minimum and maximum displayed in white.
A vertical line is shown at the position corresponding to the default operating frequency in the
current band. Ideally the point of minimum SWR of your antenna system should coincide with the
center frequency of the band.
The – and + keys can be pressed to move down and up to adjacent bands as defined in the Band
configuration screen. Pressing the R key re-runs the sweep on the existing band. Again, a hidden
feature is the use of the dot key to change the gridlines colour.
Press To tune, this activates the transmitter at the band center frequency, at the reduced power
output, and displays a realtime SWR measurement in the bottom right corner of the screen.
8.6.5 Diagnostics
This is a powerful tool for diagnosing hardware problems.
QMX operang manual; rmware 1_00_012 71
 Loading...