DMU-2000 DATA MANAGEMENT UNITPage 40
TEMPERATURE / SWR INDICATION
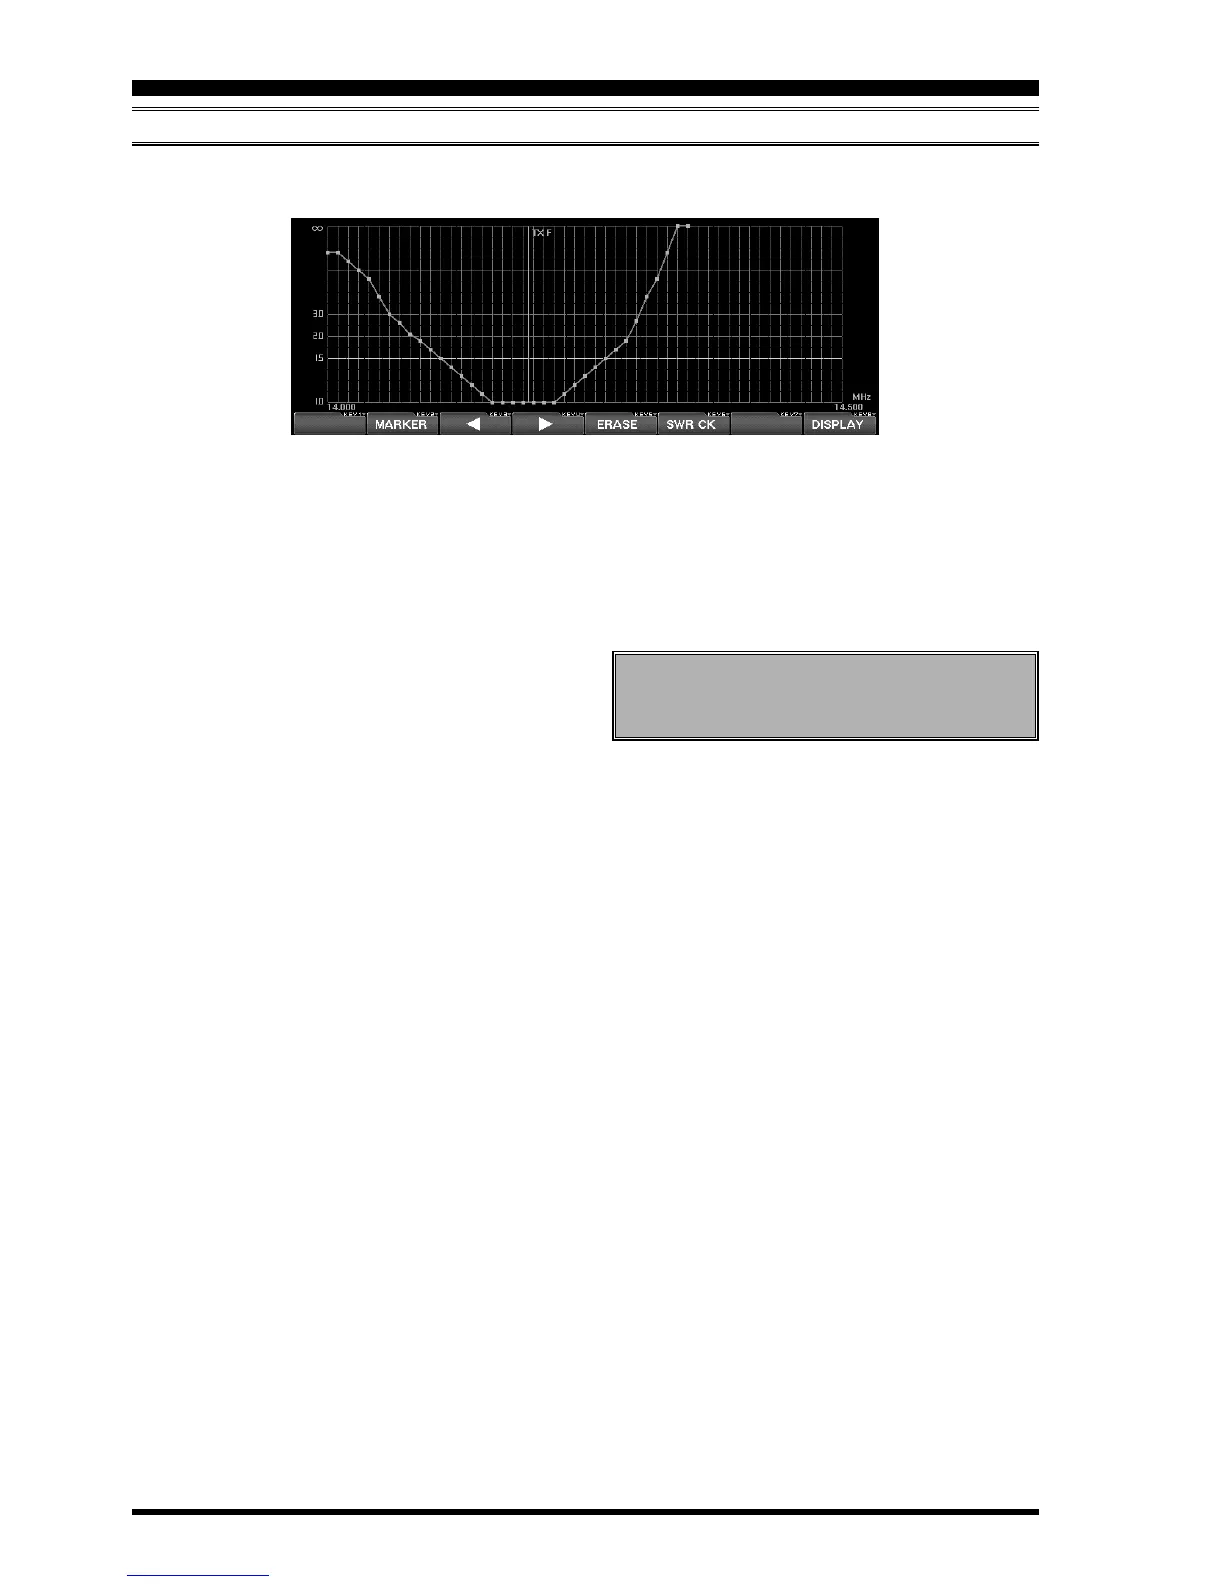
SWEPT SWR DISPLAY
It is possible to show the SWR characteristics and antenna performance on a graph by measuring the SWR at various
points across an amateur band.
In order to measure the SWR of the antenna system cor-
rectly, please turn off the antenna tuner before measur-
ing the SWR.
1. Please confirm that the RF output is over 10 Watts.
In order to measure the SWR correctly, 10 Watts of
RF output will be required. The TX RF output may be
adjusted using the
[
RF PWR
]
knob.
2. Please confirm that the test transmission will not
cause QRM to other stations (be sure to ask if the
frequency is clear, and identify in accordance with
regulations). Then press the
[
F6
(
SWR CK
)]
key.
3. Perform the above procedure several times across the
band, and the SWR measured at the various test fre-
quencies will automatically be plotted on the chart,
creating a performance characteristic graph for the
current frequency range.
Advice: For the purposes of plotting the SWR across the
band, the resolution of the graph is every 10 kHz on the
1.8 ~ 24 .9 MHz bands, and 100 kHz on the 28/50 MHz
bands.
If a measurement is done on the same frequency as where
a previous measurement was made, the old data will
cleared and the new measurement data will replace it.
Always observe proper operating courtesy to oth-
ers, and check to be sure the frequency is clear
before performing any SWR measurements.
 Loading...