Chapter 4, Accu-Chek Report
Accu-Chek Smart Pix user's manual
4-5
Report Styles
For some analyses a style is defined, either
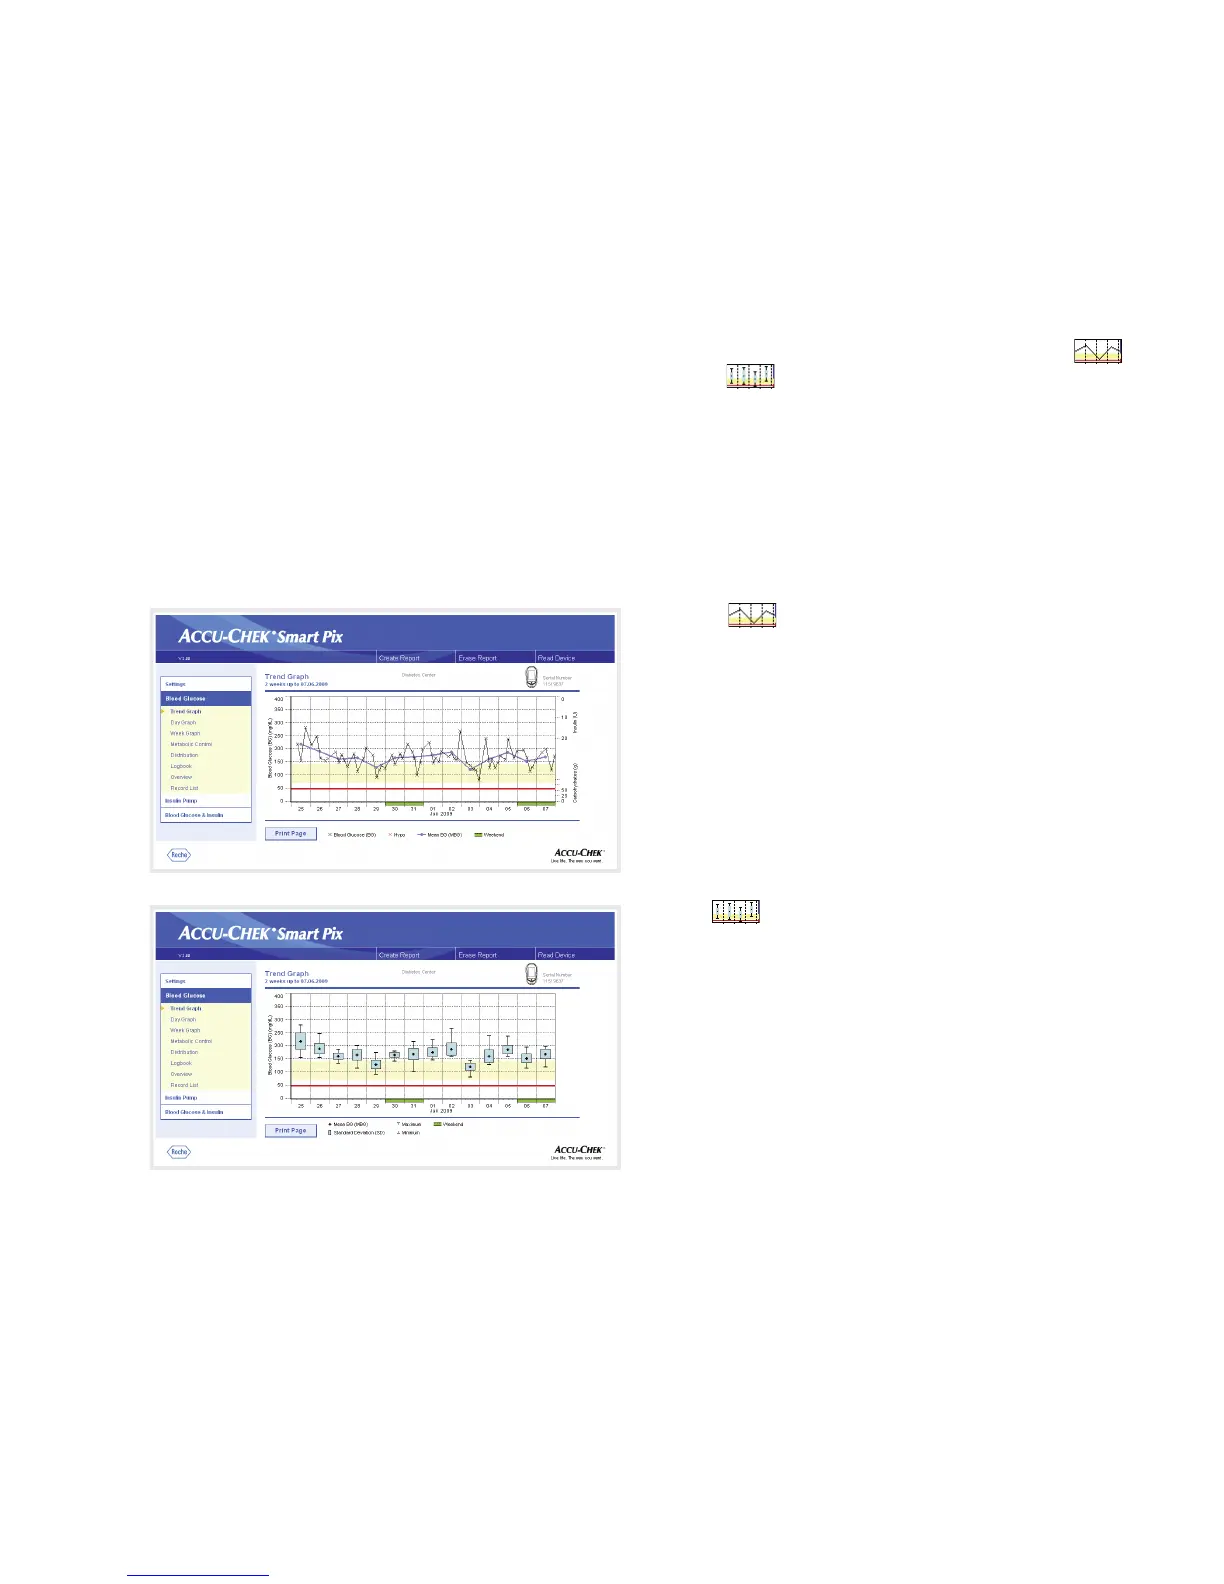
Detailed
or
Trends
, during configuration of the Accu-Chek
Smart Pix system. These two styles offer different types of
presentation for identical information. You can choose from
these styles for each of the following analyses individually:
• Trend Graph
• Day Graph
• Week Graph
Detailed
These analyses are represented in linear
form. Each test result is plotted along the time axis according
to the time when the test was performed. Test results
performed within a 10 hour period are connected by a line.
This creates (angular) “curves” which, together with the
actual test result entry, make it possible to obtain a detailed
analysis of individual results and trends.
Insulin and carbohydrate amounts (displayed in the upper
and lower edge of the report, if transferred by the device)
can only be displayed in this report style.
Trends
These analyses are time block-related, i.e.
all the test results within a certain period are assigned to a
single time block. The figures displayed are the mean value,
the variance, the minimum and the maximum of those test
results. A selective analysis of individual results is not
possible, but it is easier to make statements about general
trends within certain periods of time (time blocks/days/
weekdays).
 Loading...