Chapter 4, Accu-Chek Report
4-28
Accu-Chek Smart Pix user's manual
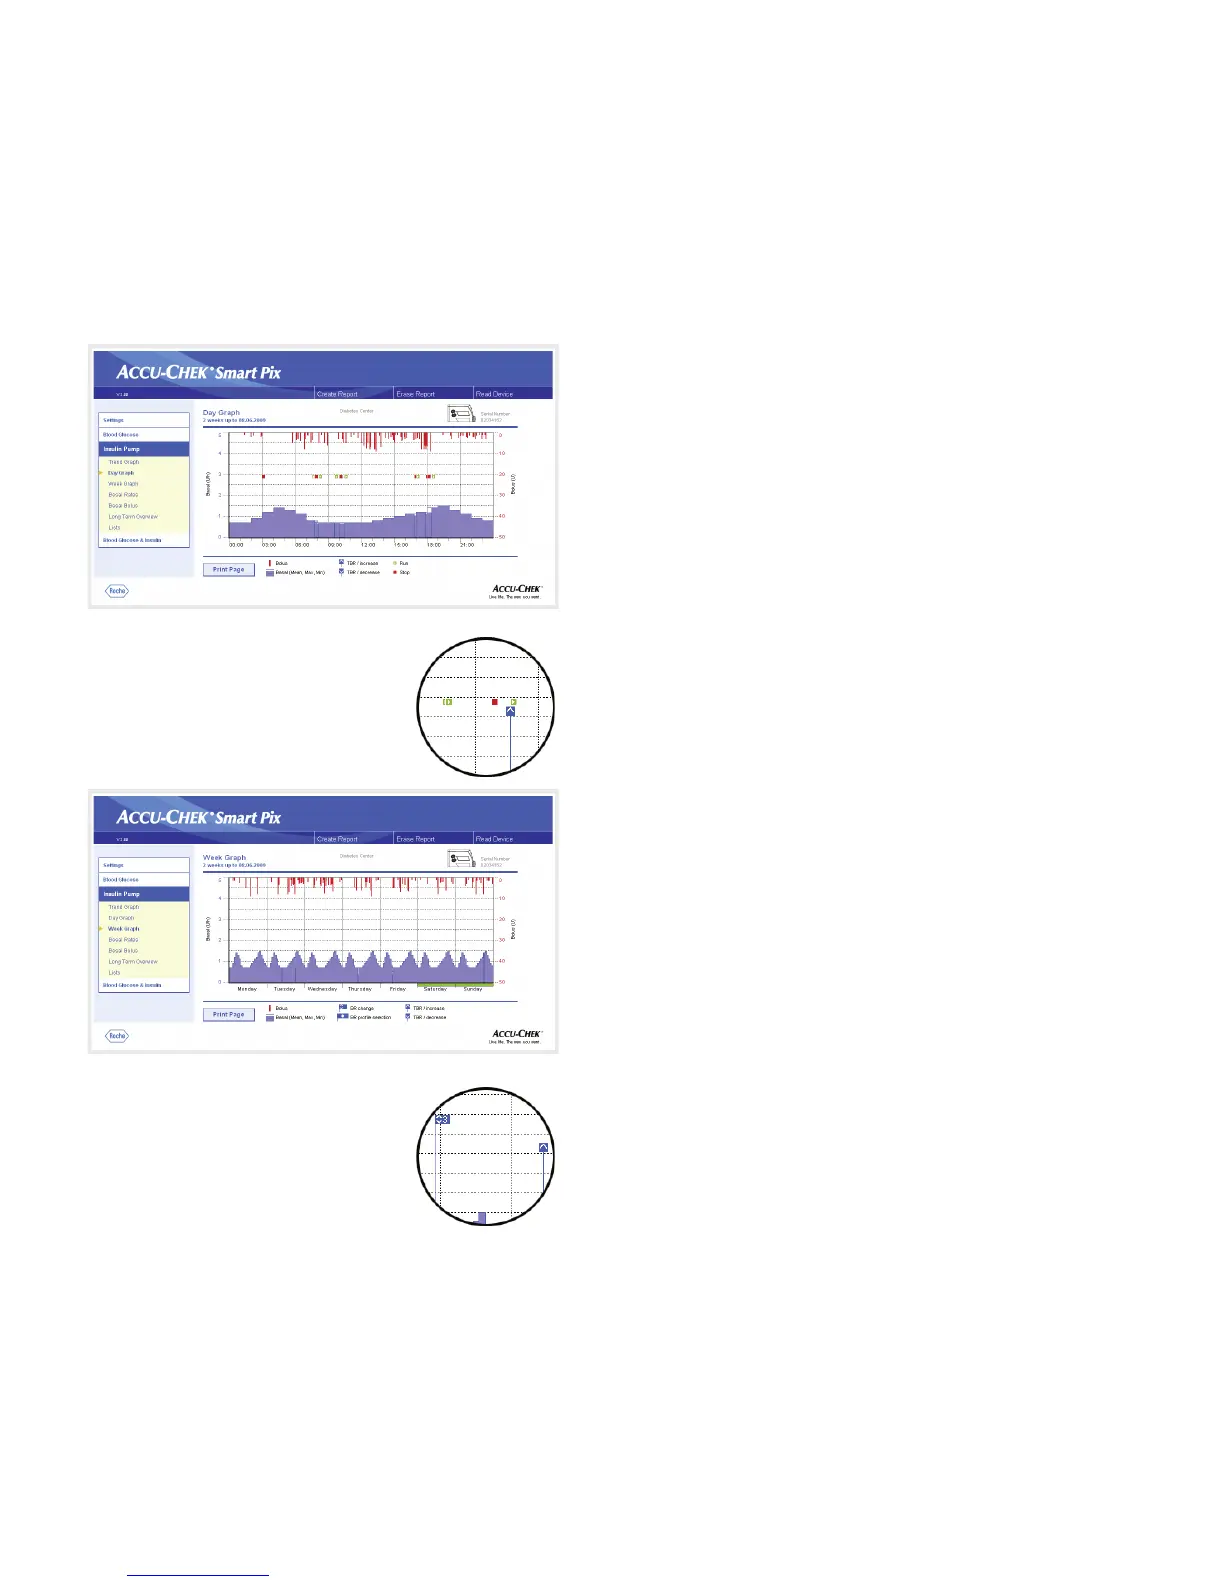
Day Graph
This analysis is used (as with blood glucose) to make it easier
to recognise and display patterns repeated daily. For this
purpose, all data is placed on a 24-hour grid. This allows you
to easily recognise frequent manual basal rate changes at
certain times, for example, thus it would be easier to
generally adjust the basal rate.
The mean basal rate is displayed as a blue filled-in area,
while the maximum and minimum basal rate at the
respective time of day is shown as a thin blue line.
On this chart, you will find not only basal rates and boluses
but also information about the start and stop of the insulin
pump and about temporary decreases and increases in the
basal rate.
Week Graph
This analysis is also used (as with the Day Graph) to make it
easier to recognise repeated patterns (e.g. repeated basal
rate changes), but in this case it depends on the day of the
week.
On this chart, you will find not only basal rates and boluses
but also information about basal rate changes and the
selection of basal profiles.
 Loading...