Chapter 4, Accu-Chek Report
Accu-Chek Smart Pix user's manual
4-27
4.5 Insulin pump: content of the report
Trend Graph
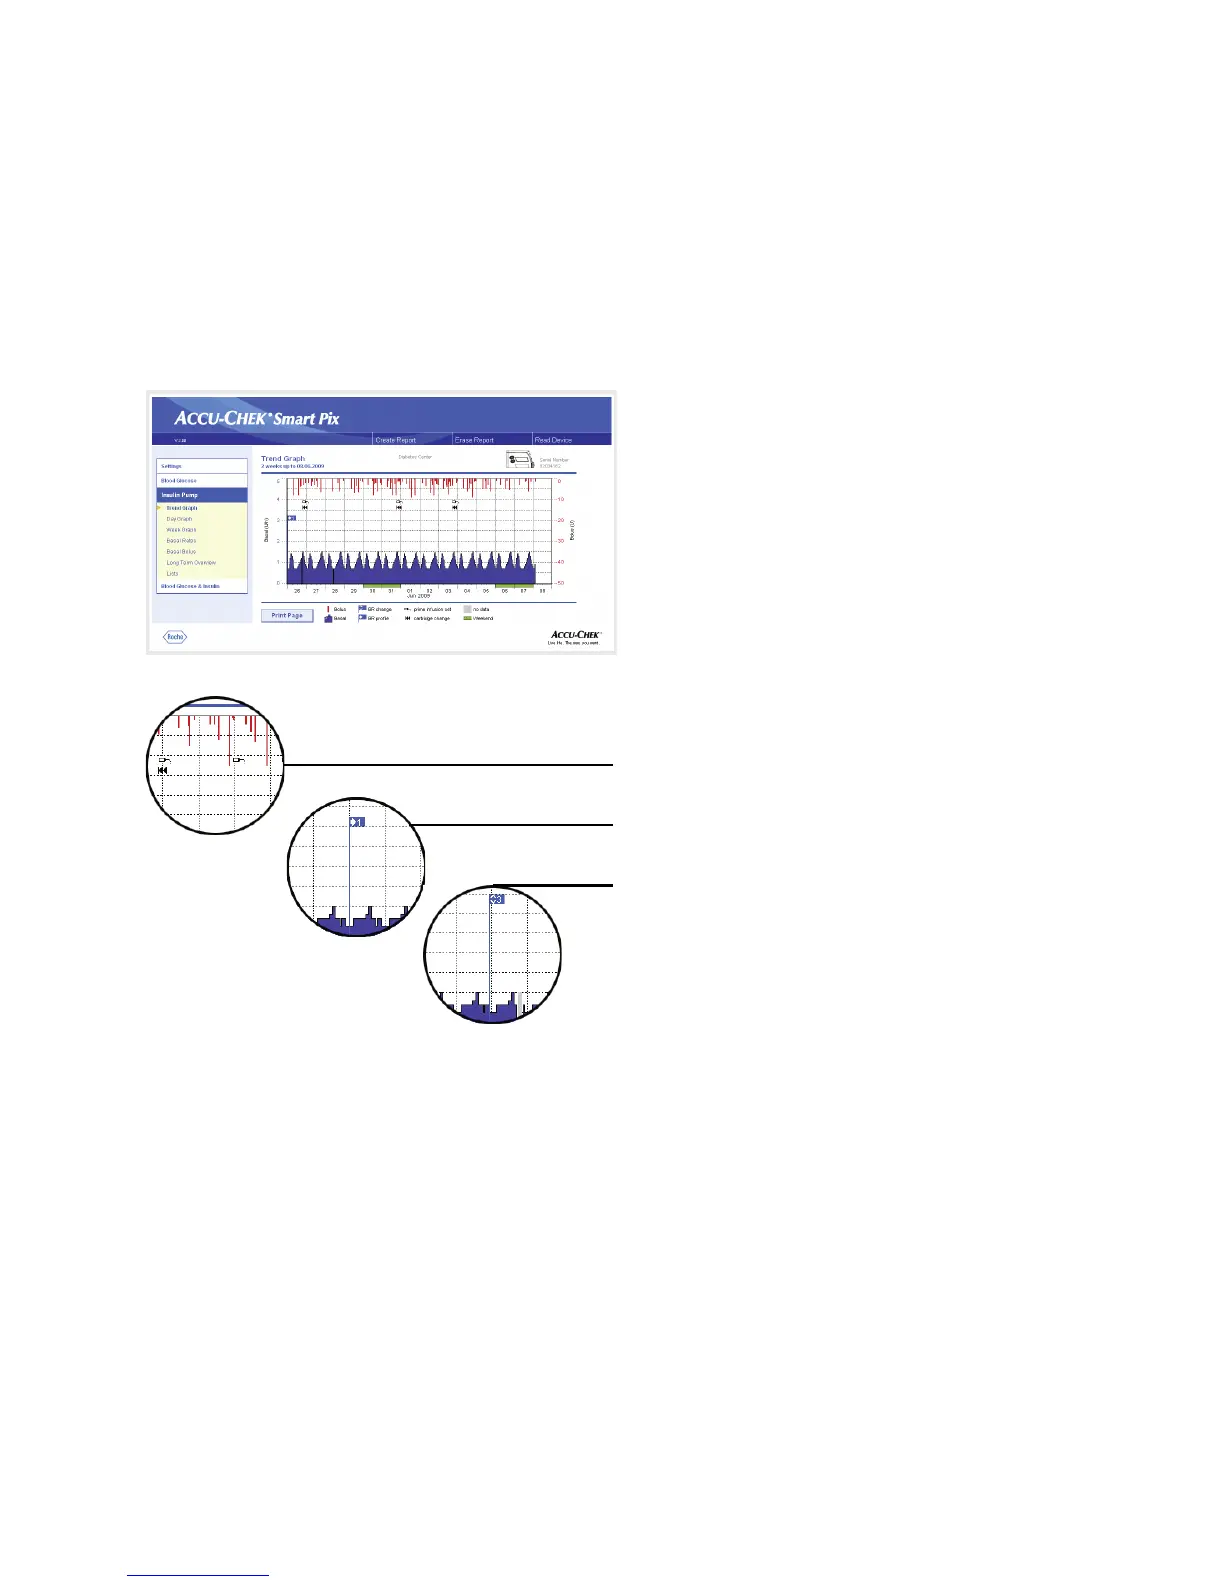
This analysis shows the trend in insulin dosage over the time
range selected. You will find the days and months along the
horizontal (x) axis and the respective amounts of insulin
delivered along the vertical (y) axis.
The basal rate chart is at the bottom, and the individual
boluses are shown at the top. Therefore, you will find the
basal rate scale along the left-hand y-axis (from the bottom
upwards) and the scale for the boluses along the right-hand
y-axis (from the top downwards).
In addition to the actual insulin dose, various events are also
shown. These are:
• Pump events (in this case: black symbols on the chart)
• Switch of basal profile (in this case: blue “flag”
symbolises a switch to basal profile 1)
• Changes in basal rate (in this case: basal profile 3)
You will find the meanings of the various symbols in brief in
the legend and in detail on page 4-25.
As in the blood glucose analysis, the days that are usually
non-working days (weekends) are marked with an additional
green bar on the horizontal axis.
 Loading...