Chapter 4, Accu-Chek Report
4-10
Accu-Chek Smart Pix user's manual
4.3 Blood glucose: content of the report
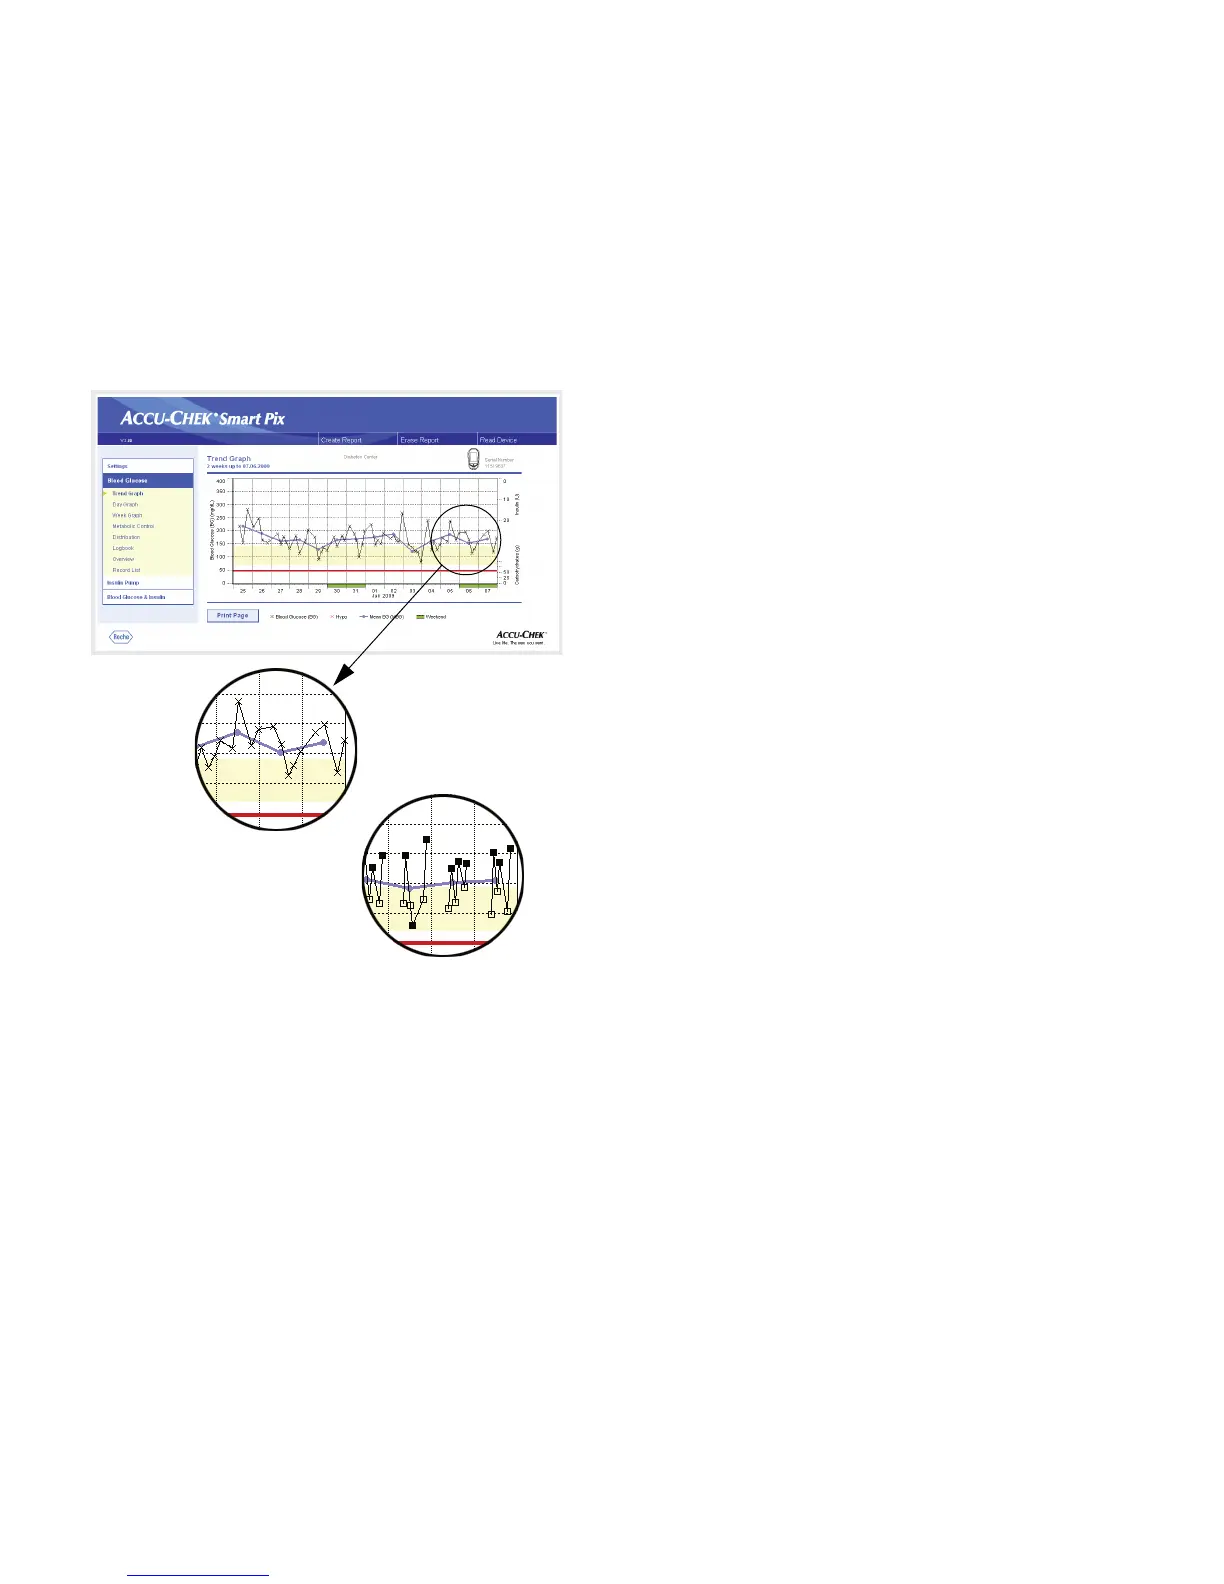
Trend Graph
Detailed:
This analysis shows the trend for several test
results over the time range selected. The results which can
be shown in this analysis are the following:
• Blood glucose results
• Insulin amounts
• Carbohydrate amounts
You will find the days and months along the horizontal (x)
axis and the blood glucose results along the vertical (y) axis.
For your guidance, the blood glucose results (represented by
various symbols) are connected through a line, provided the
various tests are no more than 10 hours apart. You will find
the meanings of the various symbols in brief in the legend
and in detail on page 4-8.
For further guidance, you can see the set target range in the
background of the chart (in the form of a yellow bar) and the
hypo threshold (in the form of a red line). Days that are
usually non-working days (weekends) are marked with an
additional green bar on the horizontal axis.
In addition to the thin connecting line between the various
blood glucose results, you will also see a (thicker) blue curve;
the day-to-day development of the mean blood glucose level.
 Loading...