Chapter 3: Graph & Table Application 105
Tip
• Graph window panning cannot be performed while any one of the following functions is being used: Modify, Trace, Sketch,
G-Solve, box zoom.
• While a panning operation is in progress on the Graph window, the coordinates of the point where the stylus is held
against the display is displayed in the status bar.
Scrolling the Graph Window
You can use either of the two operations to scroll the Graph window up,
down, left, or right.
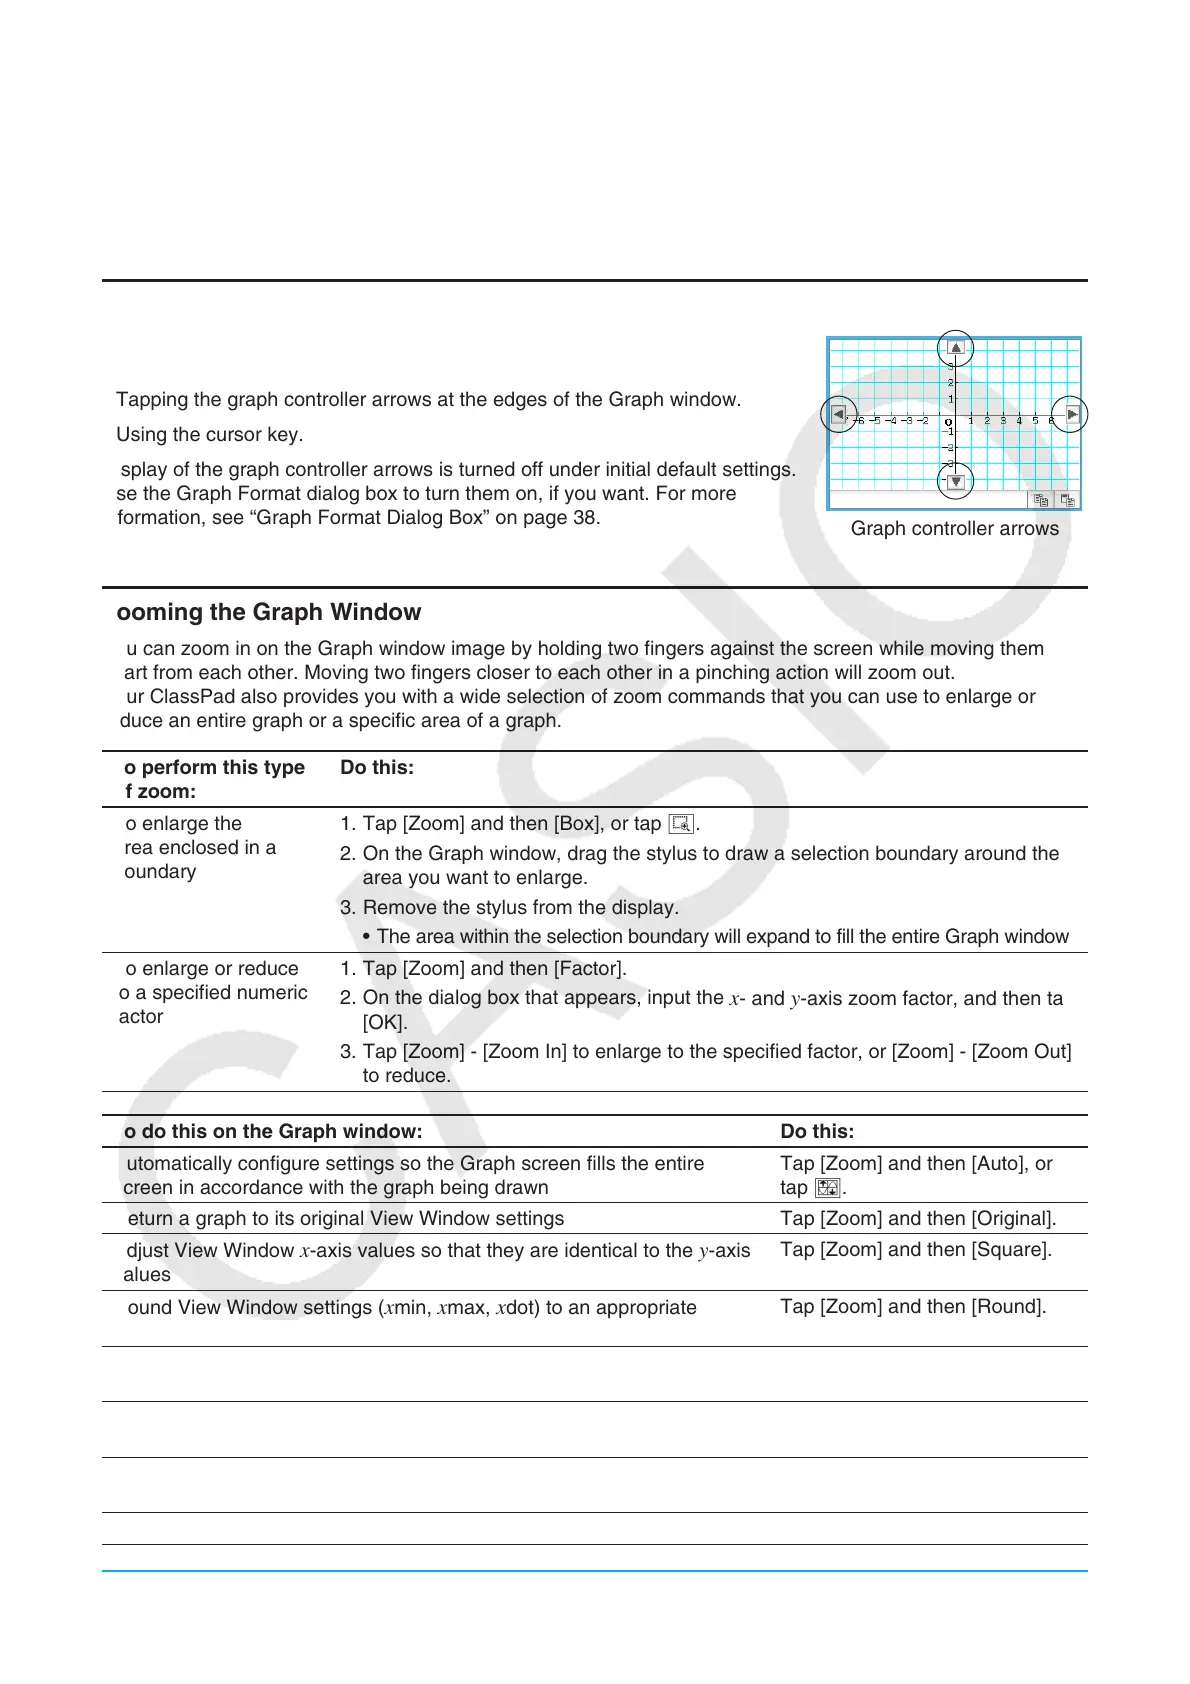
• Tapping the graph controller arrows at the edges of the Graph window.
• Using the cursor key.
Display of the graph controller arrows is turned off under initial default settings.
Use the Graph Format dialog box to turn them on, if you want. For more
information, see “Graph Format Dialog Box” on page 38.
Graph controller arrows
Zooming the Graph Window
You can zoom in on the Graph window image by holding two fingers against the screen while moving them
apart from each other. Moving two fingers closer to each other in a pinching action will zoom out.
Your ClassPad also provides you with a wide selection of zoom commands that you can use to enlarge or
reduce an entire graph or a specific area of a graph.
To perform this type
of zoom:
Do this:
To enlarge the
area enclosed in a
boundary
1. Tap [Zoom] and then [Box], or tap Q.
2. On the Graph window, drag the stylus to draw a selection boundary around the
area you want to enlarge.
3. Remove the stylus from the display.
• The area within the selection boundary will expand to fill the entire Graph window.
To enlarge or reduce
to a specified numeric
factor
1. Tap [Zoom] and then [Factor].
2. On the dialog box that appears, input the
x- and y-axis zoom factor, and then tap
[OK].
3. Tap [Zoom] - [Zoom In] to enlarge to the specified factor, or [Zoom] - [Zoom Out]
to reduce.
To do this on the Graph window: Do this:
Automatically configure settings so the Graph screen fills the entire
screen in accordance with the graph being drawn
Tap [Zoom] and then [Auto], or
tap R.
Return a graph to its original View Window settings Tap [Zoom] and then [Original].
Adjust View Window
x-axis values so that they are identical to the y-axis
values
Tap [Zoom] and then [Square].
Round View Window settings (
xmin, xmax, xdot) to an appropriate
number of decimal places and redraw the graph
Tap [Zoom] and then [Round].
Make the value of each dot equal 1, which makes all coordinate values
integers
Tap [Zoom] and then [Integer].
Return View Window parameters to their settings prior to the last zoom
operation
Tap [Zoom] and then [Previous].
Return View Window parameters to their initial default (see “Initial
(Default)” under “View Window Preset Parameters” on page 103)
Tap [Zoom] and then [Initialize].
Redraw graphs using preset View Window parameter values See “Using Quick Zoom” below.

 Loading...