Chapter 7: Statistics Application 151
Distributions
There is a variety of different types of distribution, but the most well-known is “normal distribution”, which is
essential for performing statistical calculations. Normal distribution is a symmetrical distribution centered on the
greatest occurrences of mean data (highest frequency), with the frequency decreasing as you move away from
the center. Poisson distribution, geometric distribution, and various other distribution shapes are also used,
depending on the data type.
Tip: Though list data can be used within the argument of a Distribution function (page 85), list data cannot be used in the
argument of the Statistics Wizard operations described here.
The following describes the ClassPad commands for executing each type of distribution calculation. It includes
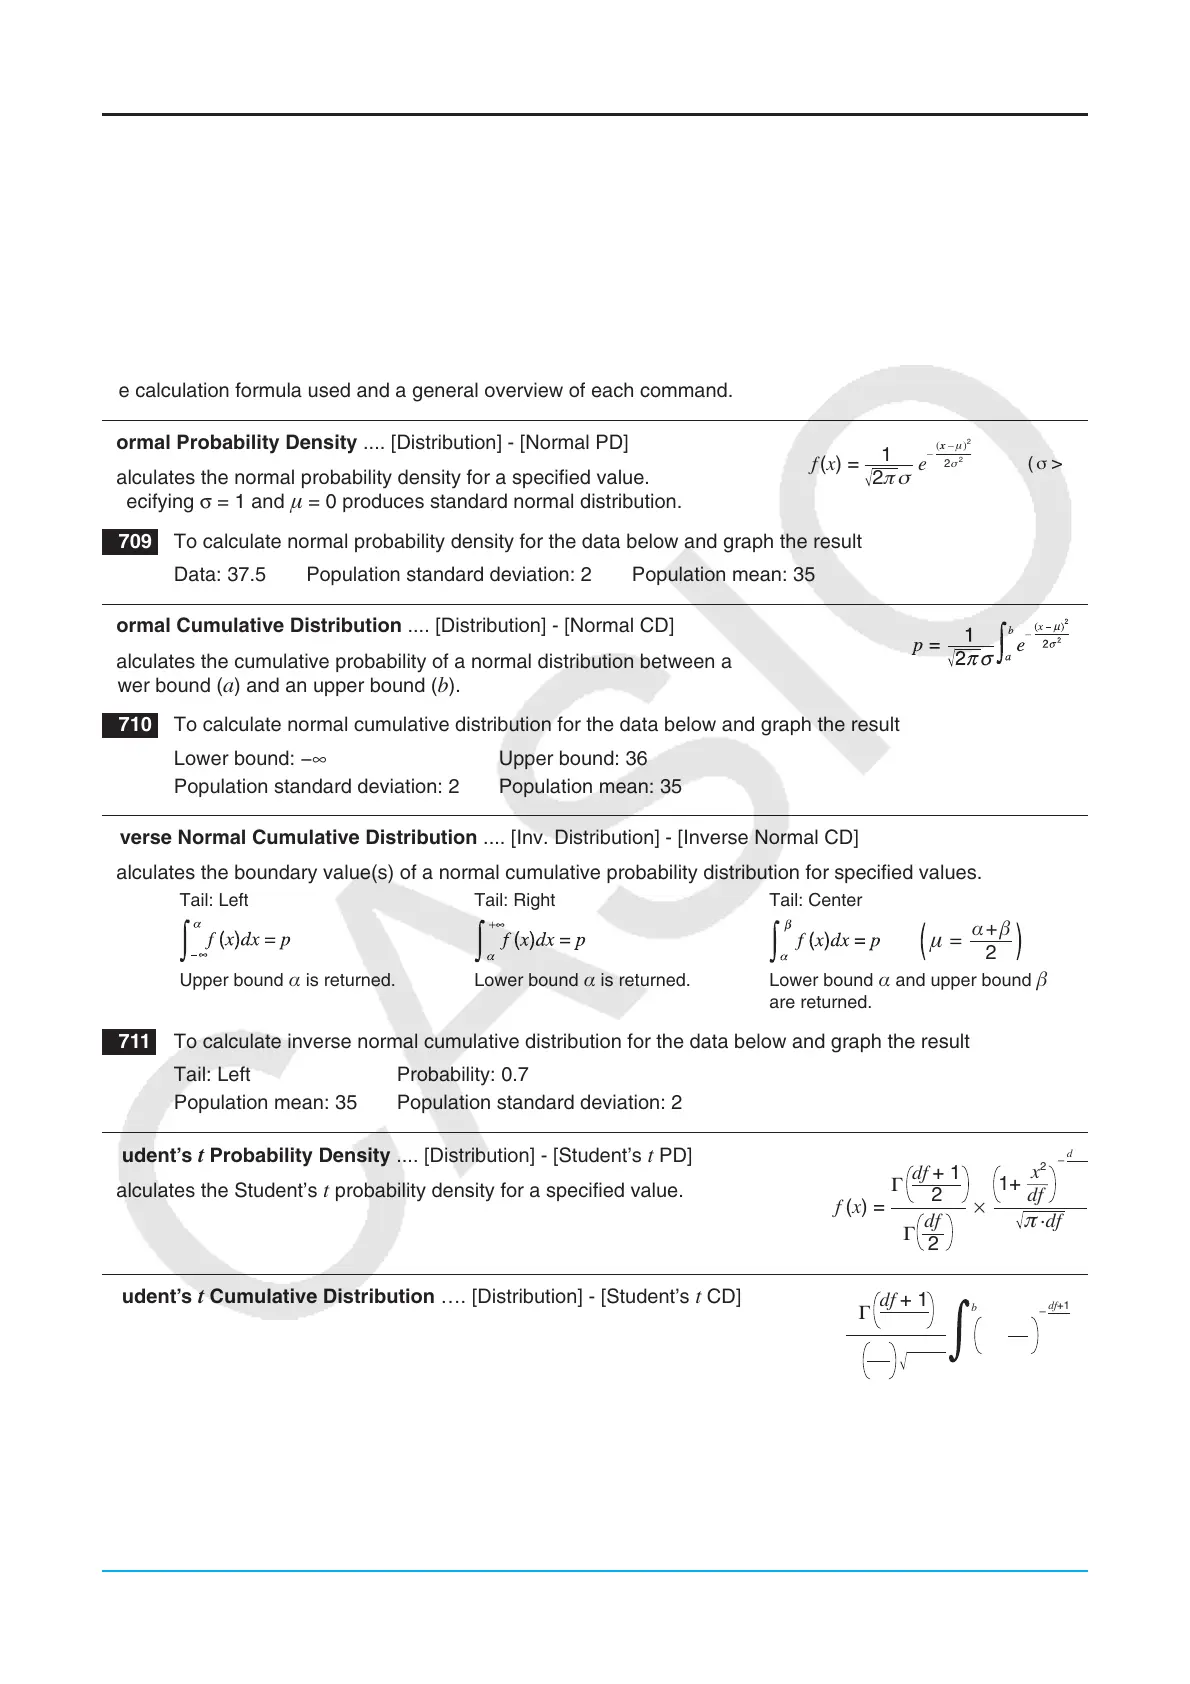
the calculation formula used and a general overview of each command.
Normal Probability Density .... [Distribution] - [Normal PD]
Calculates the normal probability density for a specified value.
Specifying σ = 1 and
= 0 produces standard normal distribution.
0709 To calculate normal probability density for the data below and graph the result
Data: 37.5 Population standard deviation: 2
Population mean: 35
Normal Cumulative Distribution .... [Distribution] - [Normal CD]
Calculates the cumulative probability of a normal distribution between a
lower bound (
a) and an upper bound (b).
0710 To calculate normal cumulative distribution for the data below and graph the result
Lower bound: −∞ Upper bound: 36
Population standard deviation: 2
Population mean: 35
Inverse Normal Cumulative Distribution .... [Inv. Distribution] - [Inverse Normal CD]
Calculates the boundary value(s) of a normal cumulative probability distribution for specified values.
Tail: Left Tail: Right Tail: Center
2
+
=
Upper bound is returned. Lower bound is returned. Lower bound and upper bound
are returned.
0711 To calculate inverse normal cumulative distribution for the data below and graph the result
Tail: Left Probability: 0.7
Population mean: 35 Population standard deviation: 2
Student’s
t Probability Density .... [Distribution] - [Student’s t PD]
Calculates the Student’s
t probability density for a specified value.
Student’s
t Cumulative Distribution …. [Distribution] - [Student’s t CD]
Calculates the cumulative probability of a Student’s
t distribution
between a lower bound (a) and an upper bound (b).
πσ
2
(x) =
(
σ
> 0)
1
e
–
2
2
σ
(x – μ)
2
μ
dx
(x) = ×
Γ
Γ
2
df
2
df + 1
.
df
π
–
df+1
2
df
x
2
1+
p =
Γ
Γ
.
df
π
2
df
2
df + 1
–
df+1
2
df
x
2
1+
dx
a
b

 Loading...