Chapter 7: Statistics Application 143
3 is the value whose cumulative frequency
ratio is greater than or equal to 1/4 and
nearest to 1/4, so Q
1
= 3.
5 is the value whose cumulative frequency
ratio is greater than or equal to 3/4 and
nearest to 3/4, so Q
3
= 5.
Reference Point (0.25) Reference Point (0.75)
Q
1
0.1 0.2 0.4 0.7 0.8 0.9 1.0
Q
3
1 2 63 3 4 4 4 75
• Median is calculated using the same method as that used when the [Q
1
, Q
3
on Data] check box is
unchecked.
• It makes no different whether frequency values are all integers or include decimal fraction values when the
[Q
1
, Q
3
on Data] check box is selected.
u To display paired-variable calculation results
1. On the Stat Editor window or Stat Graph window, tap [Calc] - [Two-Variable].
2. On the dialog box that appears, specify the [XList] and [YList] names, select the [Freq] setting, and then tap
[OK].
• This displays the dialog box with the paired-variable statistical calculation results described below.
o, p : sample mean
Σ
x, Σy : sum of data
Σ
x
2
, Σy
2
: sum of squares
σ
x
, σ
y
: population standard
deviation
s
x
, s
y
: sample standard deviation
n : sample size
Σ
xy : sum of products of
XList and YList data
minX, minY : minimum
maxX, maxY : maximum
Performing Regression Calculations
You can use the procedures under “Overlaying a Regression Graph on a Scatter Plot” (page 139) to specify a
model formula, and determine and graph the regression formula for paired-variable data. The dialog box that
appears when performing these operations provides the coefficients, constant term, and other values for the
regression formula. You can also copy the regression formula to the Graph Editor window and perform residual
calculation (which calculates the distance between the regression model and an actual plotted point during
regression calculations).
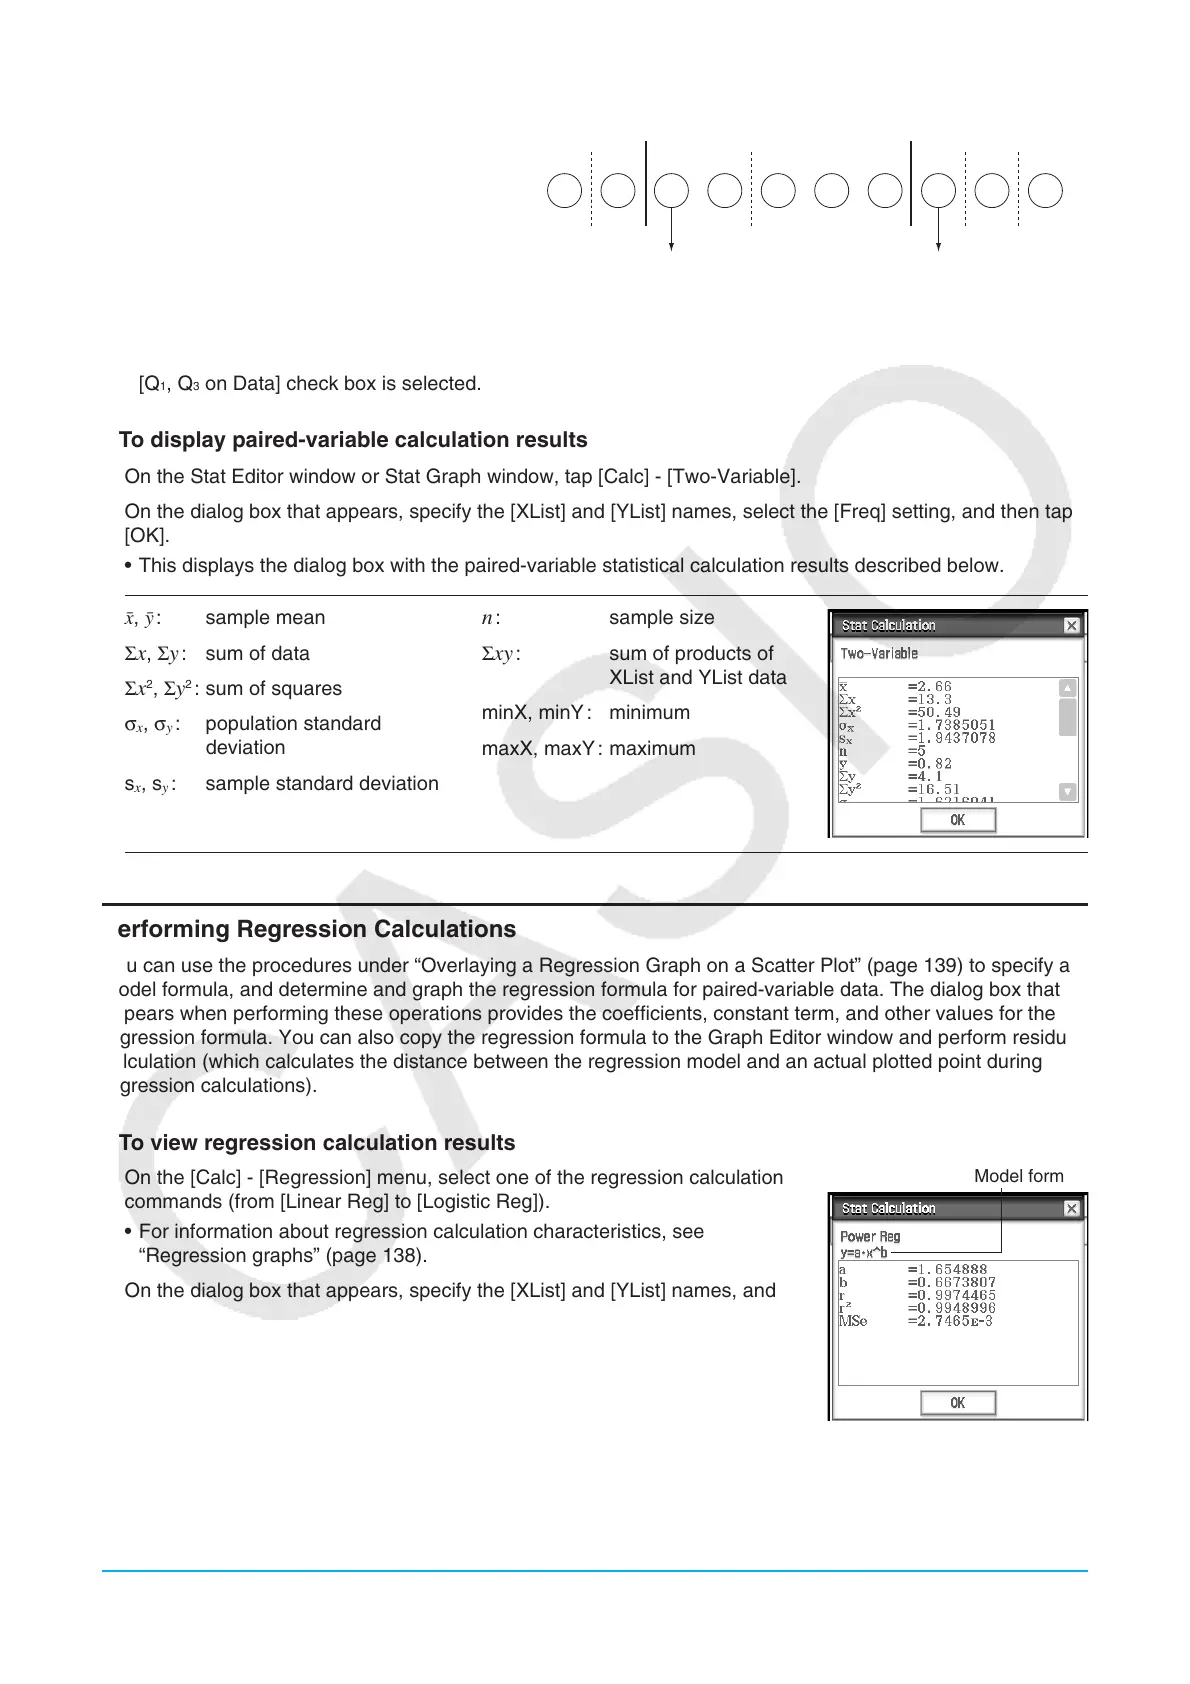
u To view regression calculation results
1. On the [Calc] - [Regression] menu, select one of the regression calculation
commands (from [Linear Reg] to [Logistic Reg]).
• For information about regression calculation characteristics, see
“Regression graphs” (page 138).
2. On the dialog box that appears, specify the [XList] and [YList] names, and
select the [Freq] setting.
Model formula

 Loading...