Chapter 7: Statistics Application 144
3. Tap [OK].
• This displays the dialog box with the regression calculation results described below.
a, b, c, d, e : coefficients of the model formula (shown at the top of the dialog box) corresponding to the
regression calculation
r : correlation coefficient (linear regression, logarithmic regression, exponential regression, and
power regression only)
r
2
: coefficient of determination (except for Med-Med, sinusoidal regression, and logistic regression)
MSe : mean square error (except for Med-Med)
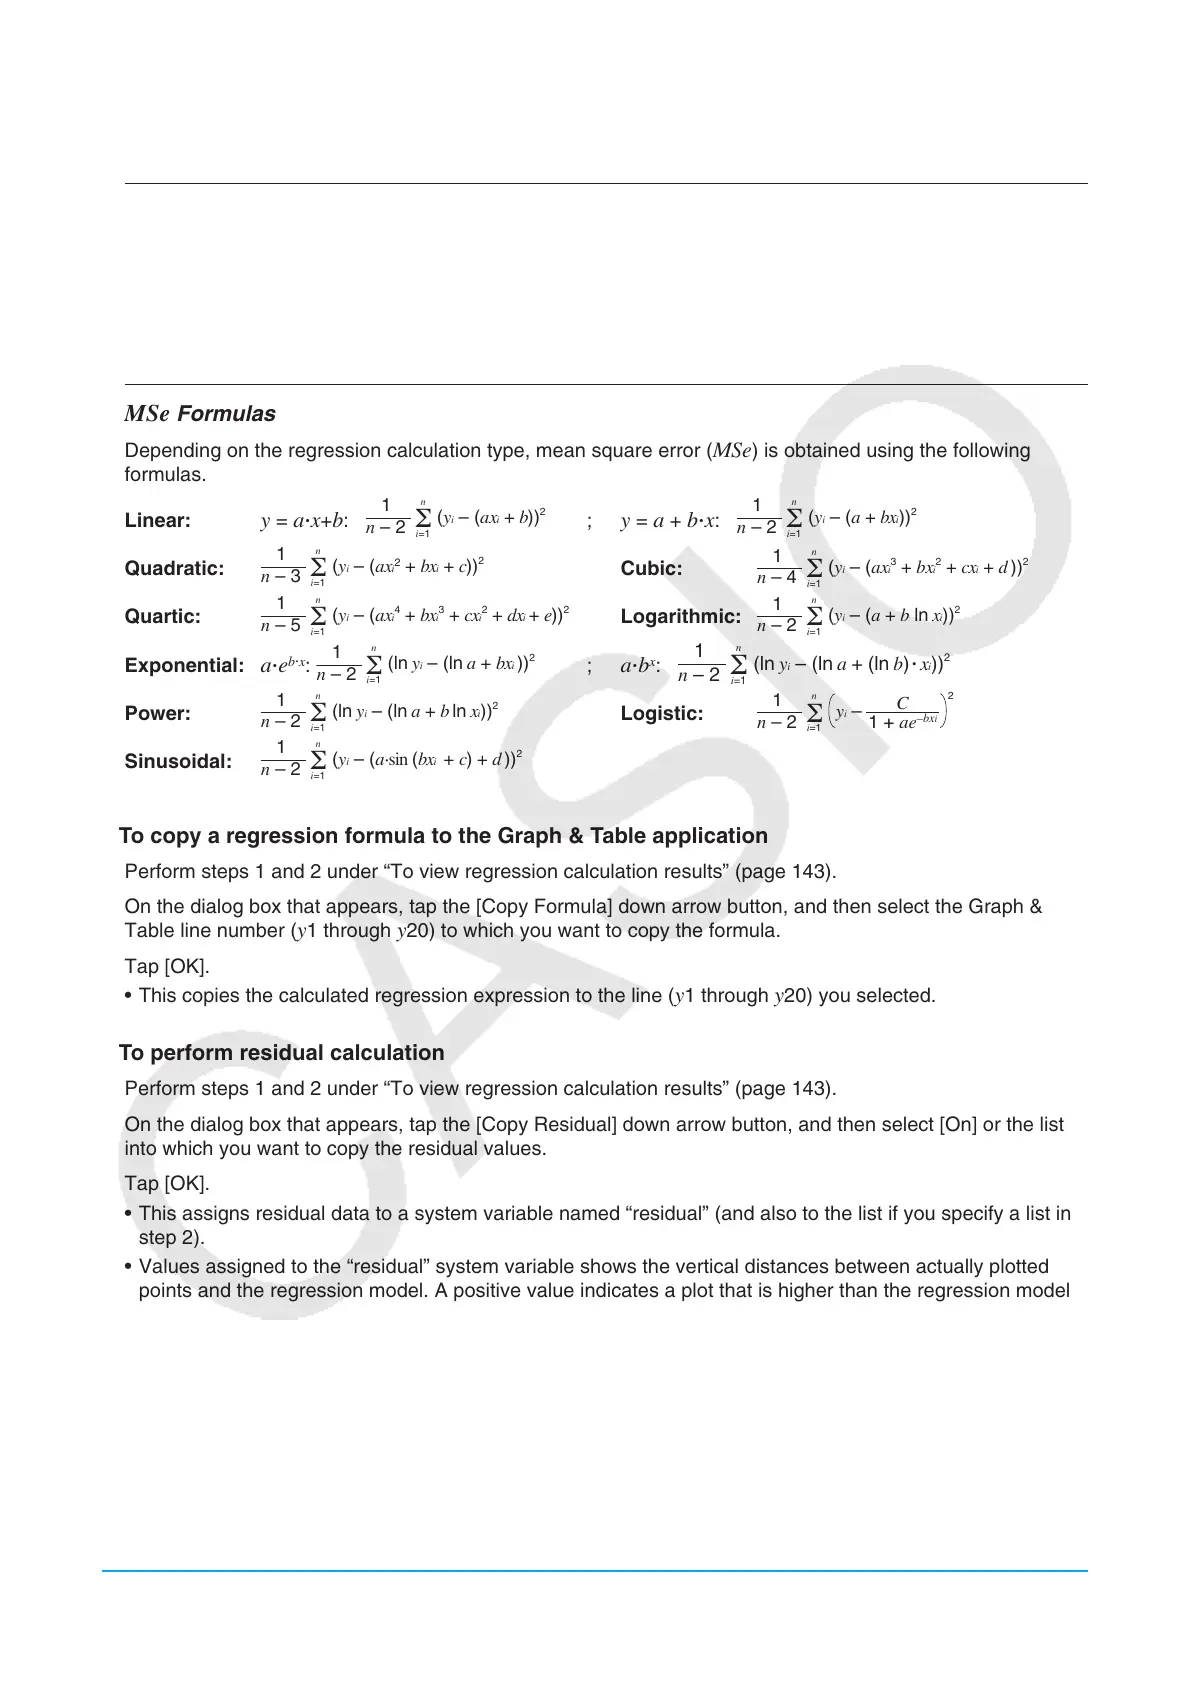
MSe Formulas
Depending on the regression calculation type, mean square error (MSe) is obtained using the following
formulas.
Linear:
y = aⴢx+b: ;
Quadratic:
Quartic:
Exponential:
aⴢe
b
ⴢ
x
: ;
Power:
Sinusoidal:
y = a + bⴢx:
Cubic:
Logarithmic:
aⴢb
x
:
Logistic:
u To copy a regression formula to the Graph & Table application
1. Perform steps 1 and 2 under “To view regression calculation results” (page 143).
2. On the dialog box that appears, tap the [Copy Formula] down arrow button, and then select the Graph &
Table line number (
y1 through y20) to which you want to copy the formula.
3. Tap [OK].
• This copies the calculated regression expression to the line (
y1 through y20) you selected.
u To perform residual calculation
1. Perform steps 1 and 2 under “To view regression calculation results” (page 143).
2. On the dialog box that appears, tap the [Copy Residual] down arrow button, and then select [On] or the list
into which you want to copy the residual values.
3. Tap [OK].
• This assigns residual data to a system variable named “residual” (and also to the list if you specify a list in
step 2).
• Values assigned to the “residual” system variable shows the vertical distances between actually plotted
points and the regression model. A positive value indicates a plot that is higher than the regression model,
while a negative value indicates a plot that is lower.
You can use the following procedure to view the current “residual” system variable values.
1. On the Stat Editor window, select any cell in the column where you want the list you will open to appear and
then tap [Edit] - [Open List].
2. Enter “residual”, and then press E.
Σ
1
n – 2
i=1
n
(yi – (axi + b))
2
Σ
1
n – 3
i=1
n
(yi – (axi
2
+ bxi + c))
2
Σ
1
n – 5
i=1
n
(yi – (axi
4
+ bxi
3
+ cxi
2
+ dxi
+ e))
2
Σ
1
n – 2
i=1
n
(ln yi – (ln a + bxi ))
2
Σ
1
n – 2
i=1
n
(ln yi – (ln a + b ln xi))
2
Σ
1
n – 2
i=1
n
(yi – (a·sin (bxi + c) + d ))
2
Σ
1
n – 2
i=1
n
(yi – (a + bxi))
2
Σ
1
n – 4
i=1
n
(yi – (axi
3
+ bxi
2
+ cxi + d ))
2
Σ
1
n – 2
i=1
n
(yi – (a + b ln xi))
2
Σ
1
n – 2
i=1
n
(ln yi – (ln a + (ln b)ⴢ xi))
2
Σ
1
n – 2 1 + ae
–bx
i
C
i=1
n
yi –
2

 Loading...