Chapter 16: Interactive Differential Calculus Application 271
16-3 Generating a Number Table and Graphing the
First Derivative and Second Derivative Using the
[D Trace] Tab
The [D Trace] tab can simultaneously handle the three types of functions below, which are based on the
functions input for “Function” on the [Function] tab.
x function y1 (= f (x))
y1 first derivative y2 = y1 (= f (x))
y1 second derivative y3 = y1 (= f (x))
You can use this tab to view the number table of y1, y2, and y3 values for each x value, and to check the graph
associated with the number table.*
* Defaults:
x, y1, y2
u To use the [D Trace] tab
Example: Simultaneously graph the function y1 = 1/3·x
3
− 3x and its first derivative y2 = y1, and compare the
graphs. Also, use the graph and number table to observe changes in each of the graph’s y-values (y1, y2),
and study the relationship between the functions.
1. On the DiffCalc Table window, display the [Function] tab.
2. In the “y:” line under “Function”, input 1/3·
x
3
− 3x.
3. Tap the [D Trace] tab.
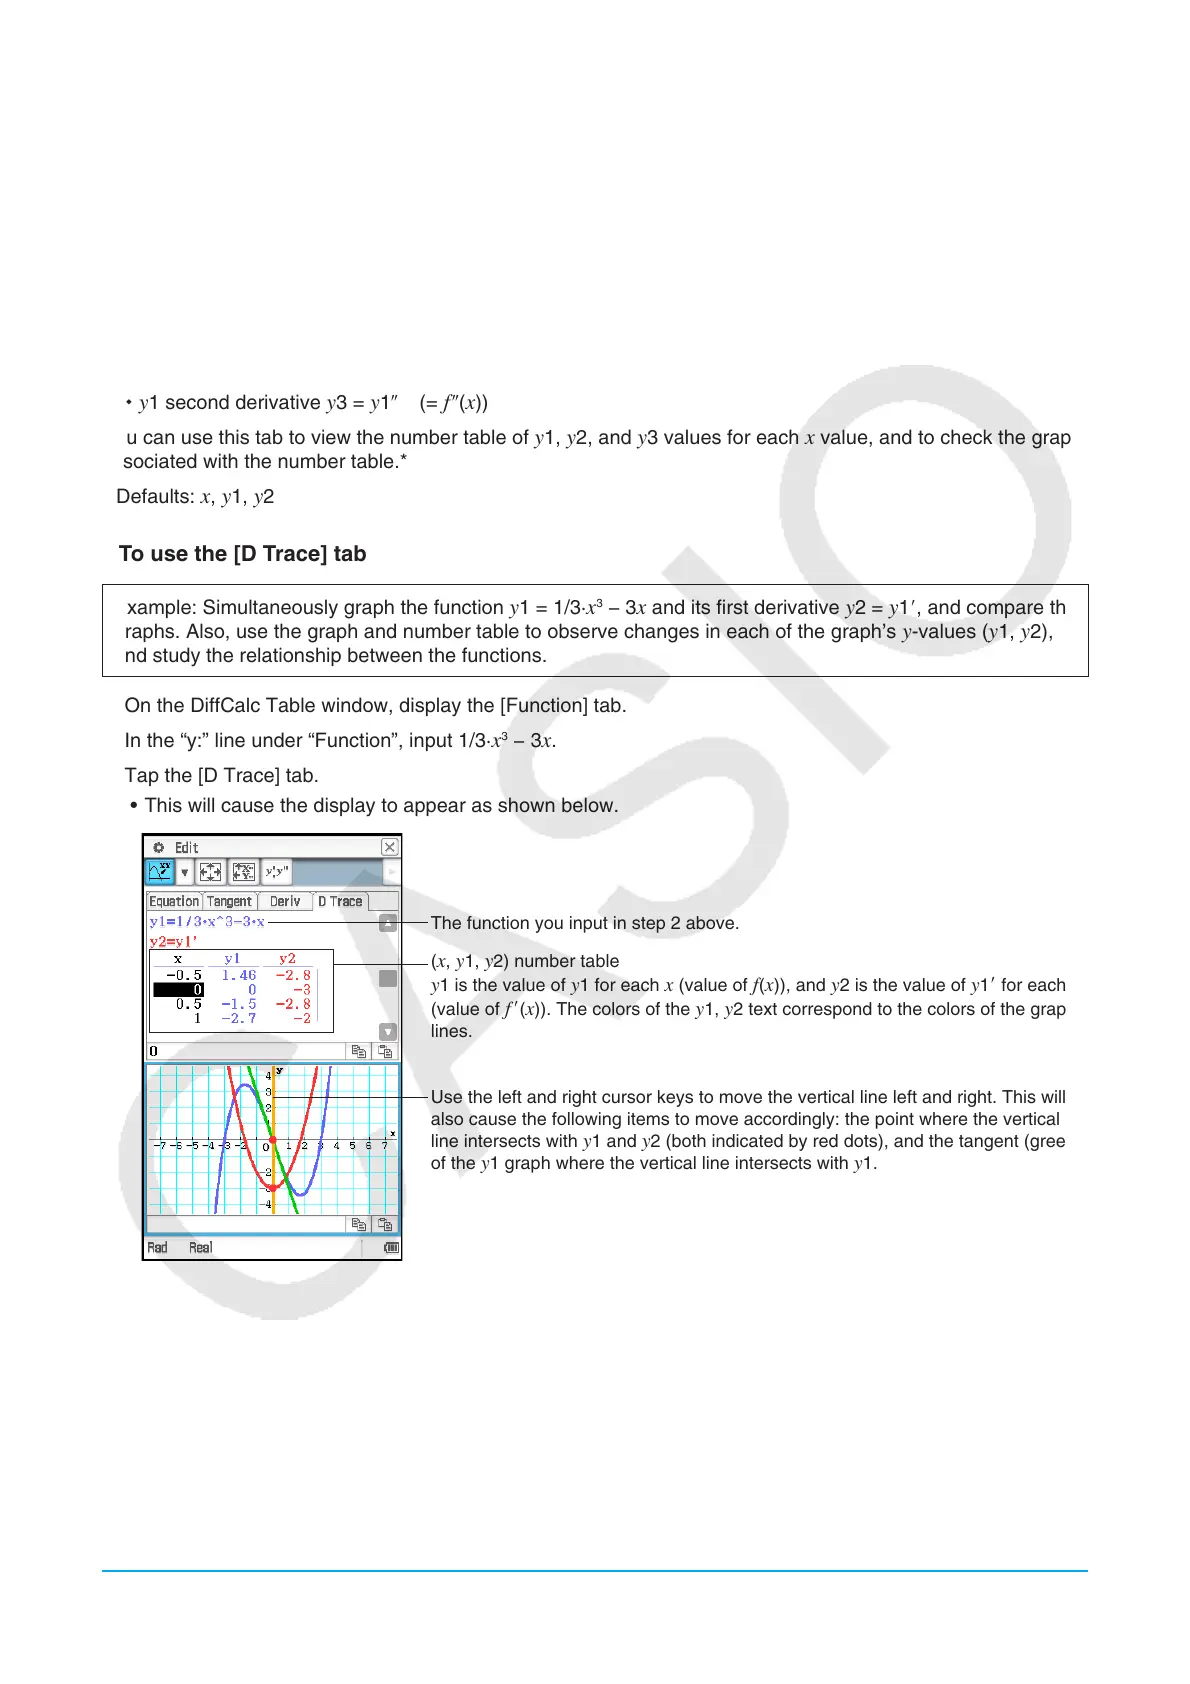
• This will cause the display to appear as shown below.
The function you input in step 2 above.
(
x, y1, y2) number table
y1 is the value of y1 for each x (value of f (x)), and y2 is the value of y1 for each x
(value of
f (x)). The colors of the y1, y2 text correspond to the colors of the graph
lines.
Use the left and right cursor keys to move the vertical line left and right. This will
also cause the following items to move accordingly: the point where the vertical
line intersects with
y1 and y2 (both indicated by red dots), and the tangent (green)
of the
y1 graph where the vertical line intersects with y1.

 Loading...