Chapter 16: Interactive Differential Calculus Application 269
16-2 Deriving the Derivative Using the [Deriv] Tab
u To use the [Deriv] tab
Example: The slope of a tangent at a point (x, y) on the graph of y = x
3
− 4x, is slope. Plot coordinates (x
1
,
slope
1
), (x
2
, slope
2
), (x
3
, slope
3
), …. (x
n
, slope
n
) on the DiffCalc Graph window, and predict the function that
passes through all of the plots. Also, use regression to confirm the function.
1. On the DiffCalc Table window, display the [Function] tab.
2. In the “
y:” line under “Function”, input x
3
− 4x.
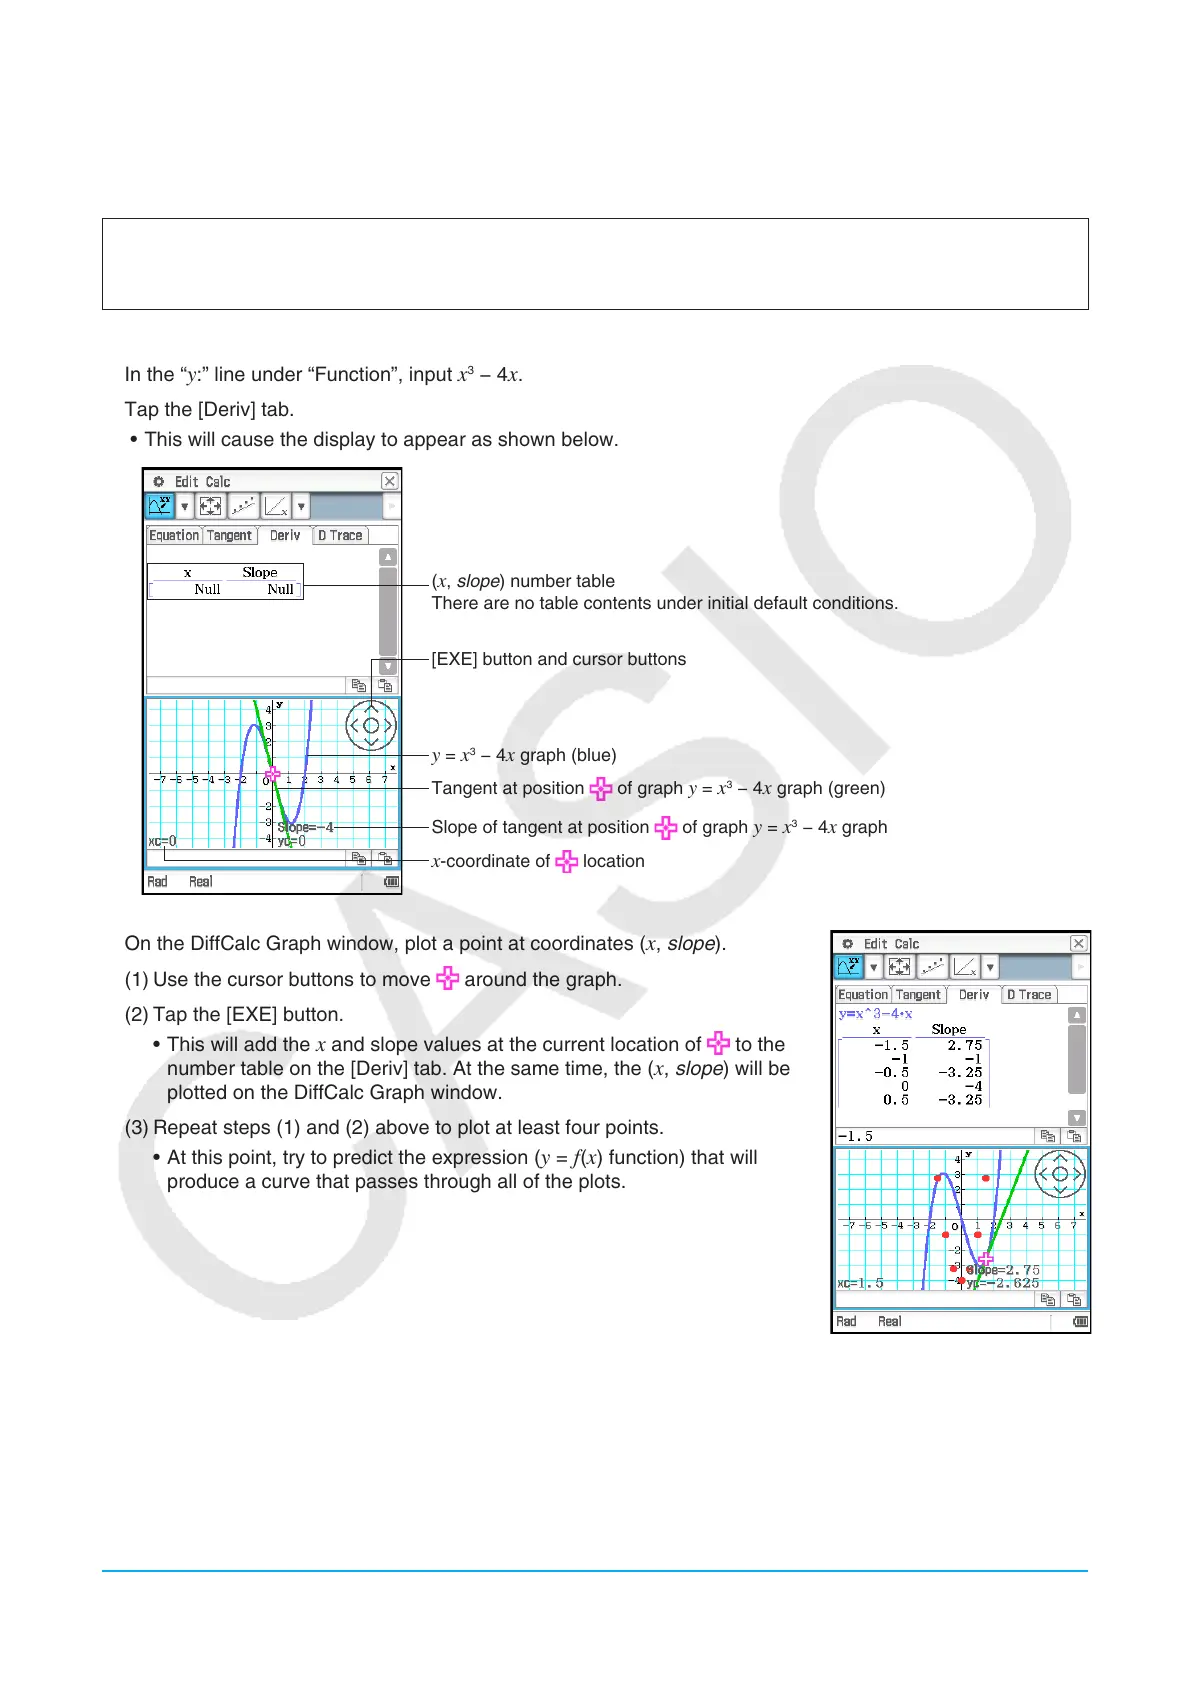
3. Tap the [Deriv] tab.
• This will cause the display to appear as shown below.
(x, slope) number table
There are no table contents under initial default conditions.
[EXE] button and cursor buttons
y = x
3
− 4x graph (blue)
Tangent at position
of graph y = x
3
− 4x graph (green)
Slope of tangent at position
of graph y = x
3
− 4x graph
x-coordinate of location
4. On the DiffCalc Graph window, plot a point at coordinates (x, slope).
(1) Use the cursor buttons to move
around the graph.
(2) Tap the [EXE] button.
• This will add the
x and slope values at the current location of to the
number table on the [Deriv] tab. At the same time, the (x, slope) will be
plotted on the DiffCalc Graph window.
(3) Repeat steps (1) and (2) above to plot at least four points.
• At this point, try to predict the expression (
y = f (x) function) that will
produce a curve that passes through all of the plots.
5. Input the expression and graph it.
• In this example, we can predict a quadratic function curve, so we will try inputting
y = 2x
2
− 4.
(1) Tap Calc - Predicted Function - Editor or D.