•
•
•
•
•
•
•
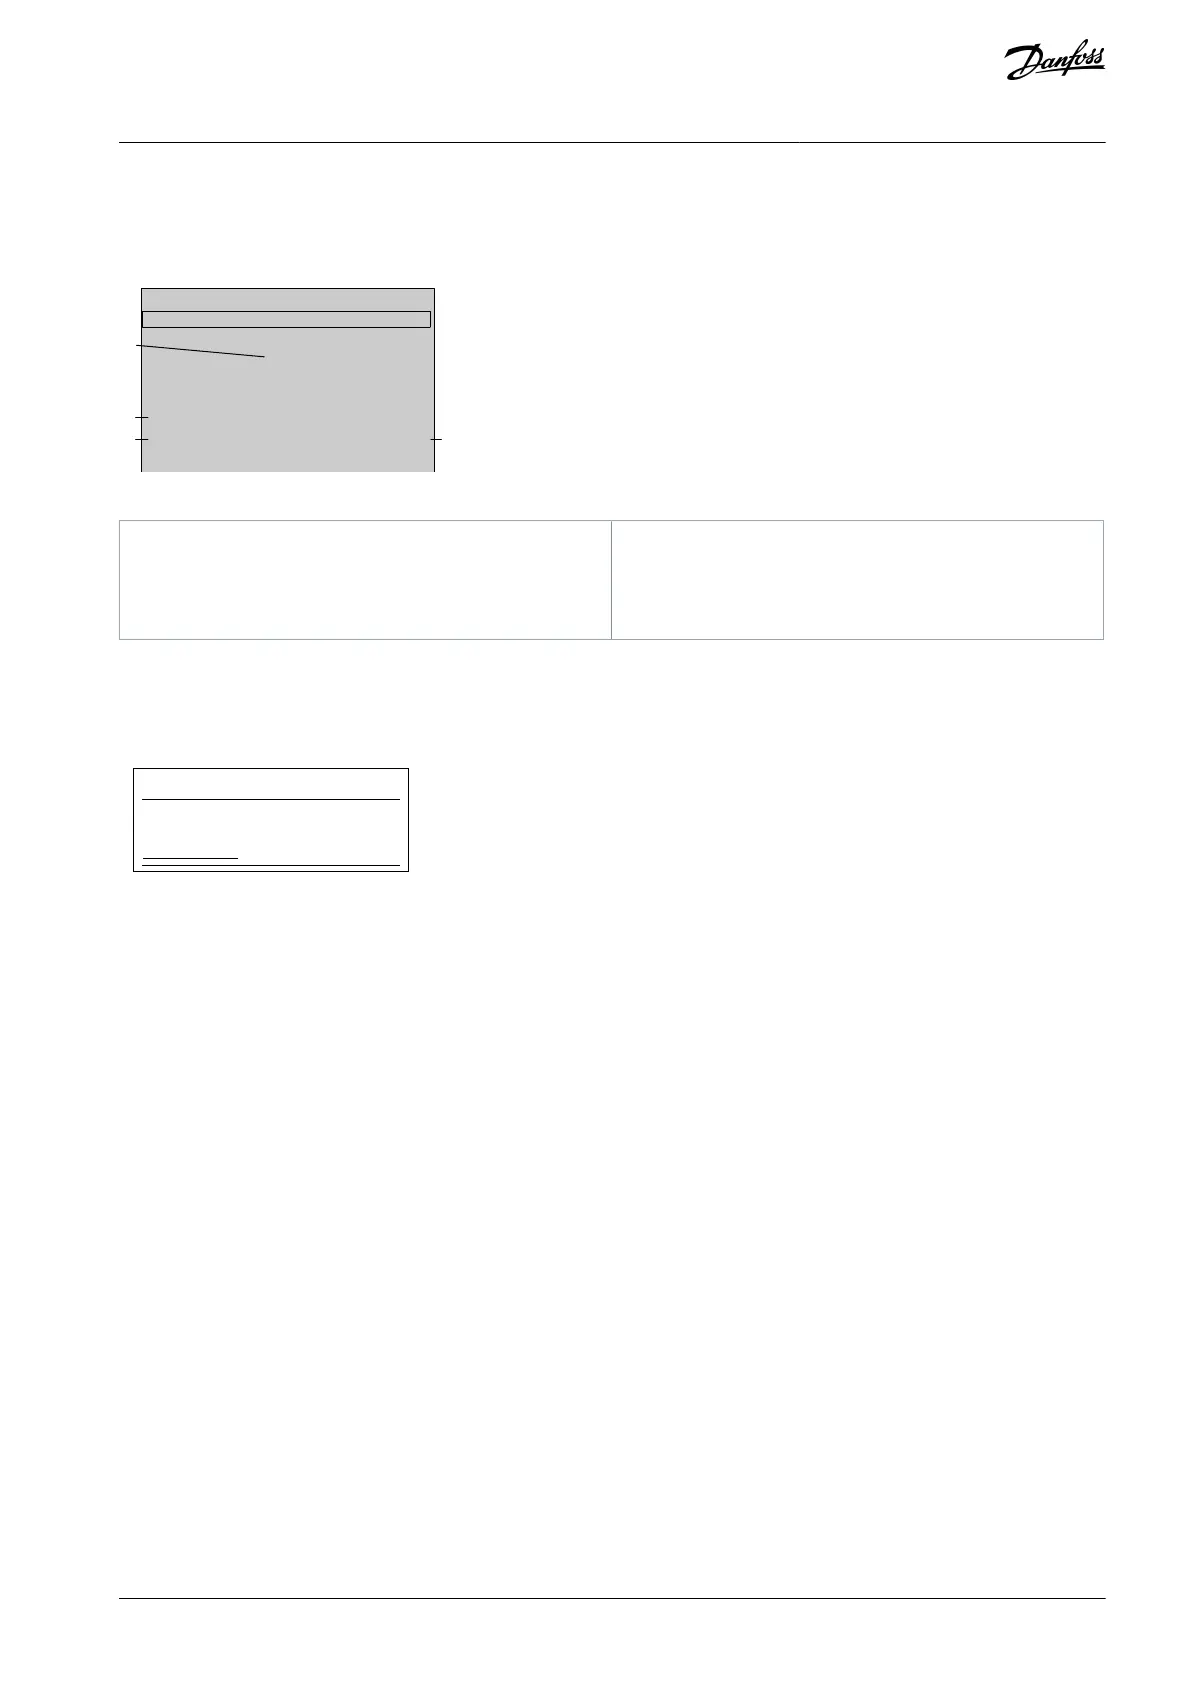
Real-time line current on each phase.
Last start information.
Date and time.
Illustration 28: Operating Feedback Screens
Maximum start current drawn (as a percentage of
motor full load current)
Calculated rise in motor temperature
8.5.4 Performance Graph
The performance graph provides a real-time display of operating performance. Use parameters 10-2 to 10-5 to format the graph.
The display on the main LCP shows information for motor current.
If a remote LCP is connected, press [Graph] to change the graph data. The graph can show:
Motor current.
Motor temperature.
Motor power factor.
Analog input data from the smart card (if installed).
AQ262141844215en-000401 / 175R1174 | 59Danfoss A/S © 2020.12
LCP and Feedback
VLT® Soft Starter MCD 600
Operating Guide
 Loading...