123
WT07996X02
1-2. Energy management
The energy-control-related status, such as electric energy consumption, operation time, and outdoor temperature,
can be displayed in a graph. Also, preset target value of the electric energy consumption can be checked.
Note: Energy use status data and ranking data can be output in a CSV format.
Note: Output to CSV is only possible on a PC. Output from tablet (Android, iOS tablet) is not possible and the [Download] button is
not displayed.
Note: File names, as well as date formats, delimiter characters, and temperature units (°C, °F) within the files output as CSV will
use formats set as initial settings. Refer to the Instruction Book (Initial Settings) for settings methods.
Note: For the file name and AE No. within the files output as CSV, refer to 4 “Name Display” in Chapter 1.
Important
● Energy management settings and measurement settings are required beforehand to display a graph. Refer to the Instruction
Book (Initial Settings) for settings methods.
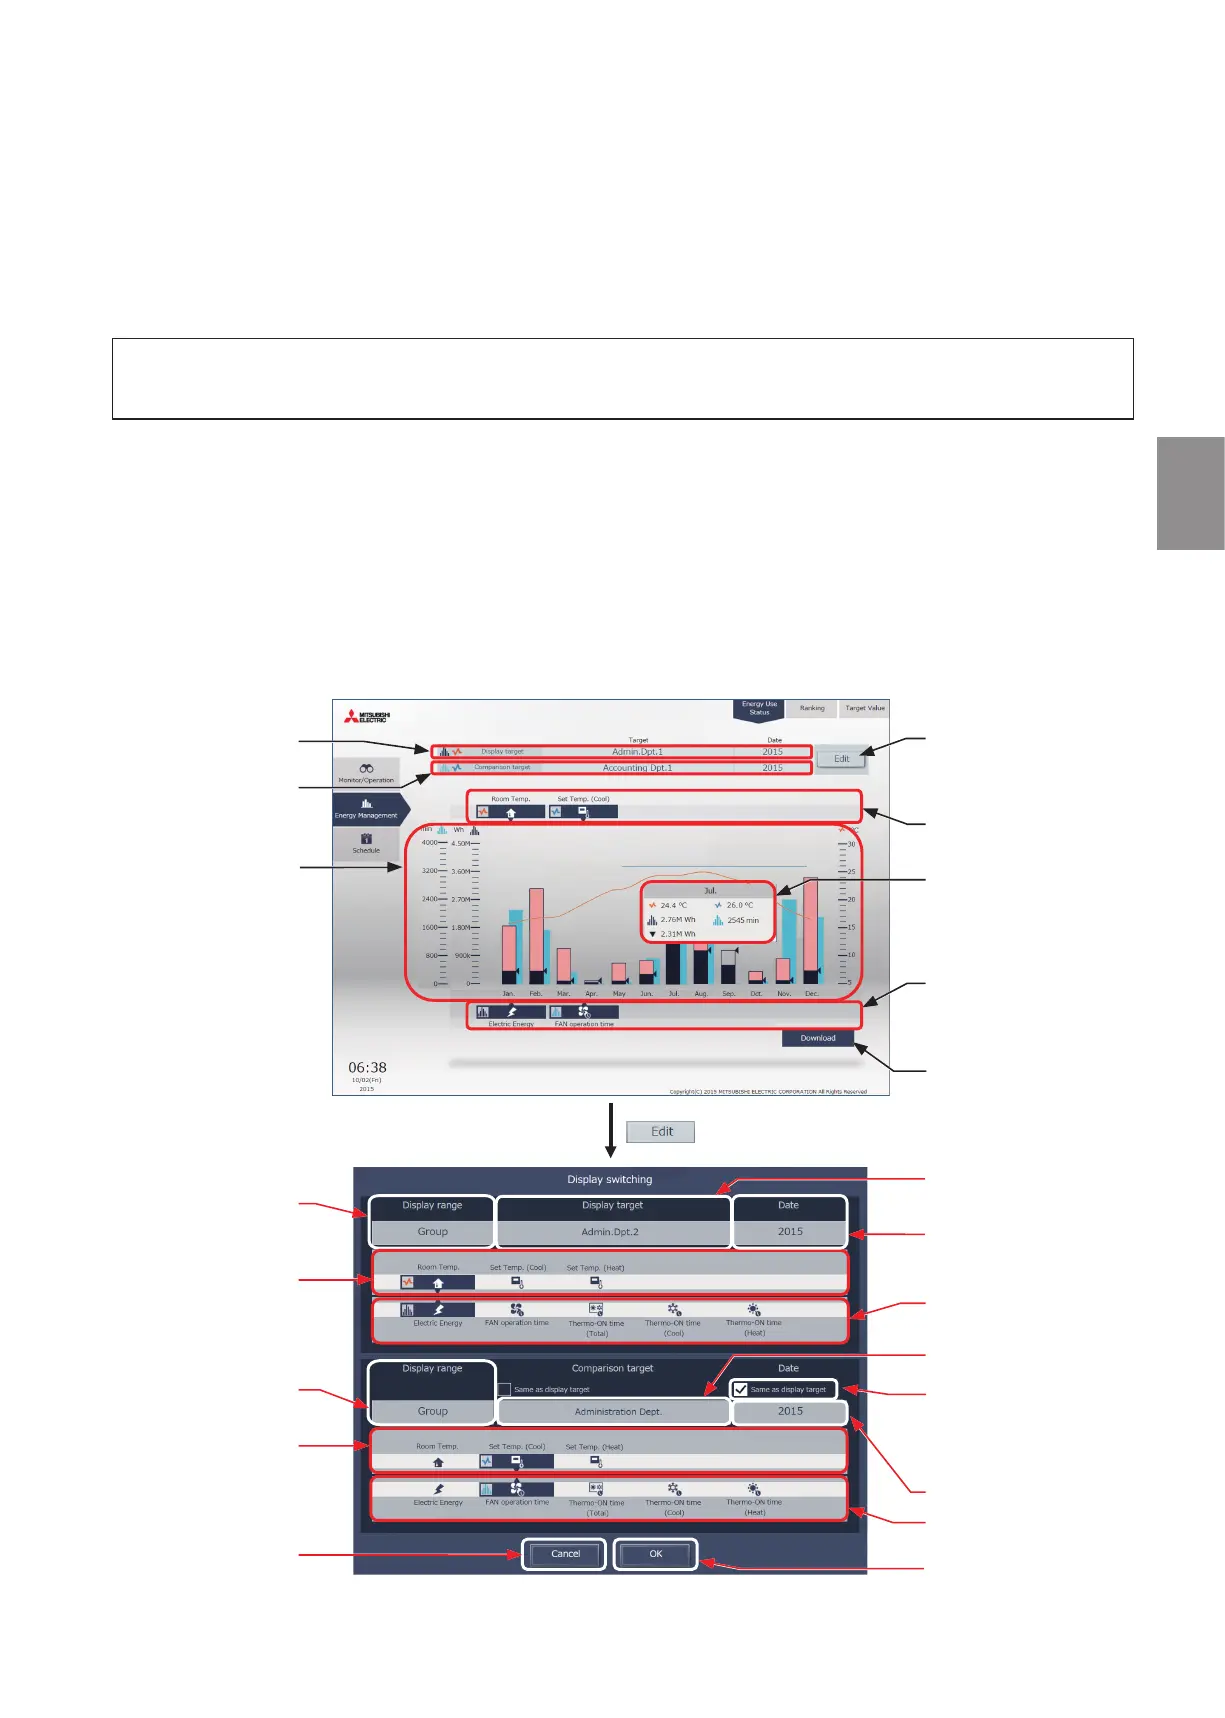
1-2-1. Energy Use Status
On the Energy Use Status screen, the energy-control-related status, such as electric energy consumption, operation
time, and room temperature, can be displayed in a graph. Operators can check the detailed status of given indoor
units by specifying the date to display the data per unit address, group, block, or energy management block.
Also, the status of other indoor units can be displayed at the same time for comparison.
Displaying energy-control-related status of each hour, day, and month in a graph visualizes the energy-saving status.
Click [Energy Management] in the menu, and then click [Energy Use Status] to access the Energy Use Status screen.
(1) Click [Edit] to set the display items.
Display target
Comparison target
Edit
Click to change the display
target and comparison
target.
Display items for line
graph
Detailed information
Mousing over the graph area
will display the values on the
bar and line graphs.
Display items for bar
graph
Graph region
Display range
Display items for line
graph
Display range
Display items for line
graph
Cancel
Click to return to the graph
screen without making any
changes.
Download
Click to output the data in a
CSV format. (This button is
not displayed on a tablet.)
Display target
Date to display the data
Display items for bar
graph
Comparison target
Same as display target
Check the checkbox to set
the same date as the date
selected in “Date to display
the data”.
Comparison date
Display items for bar
graph
OK
Click to confirm the changes
and return to the graph
screen.
For tenant managers Chapter 3
 Loading...