Behavior
This dialog box opens when you click Results Table from the Bus Setup Display tab, or in the Analyze menu, when you select
Results Table.
Symbol substitution, annotation and radix behavior is controlled by the Bus Setup control window. There is one row per bus
packet. There is one column per visible property or nondetail field in the bus. You can change the column width and column
order. Some rows or columns can be expanded to show additional details of the hierarchical bus structure.
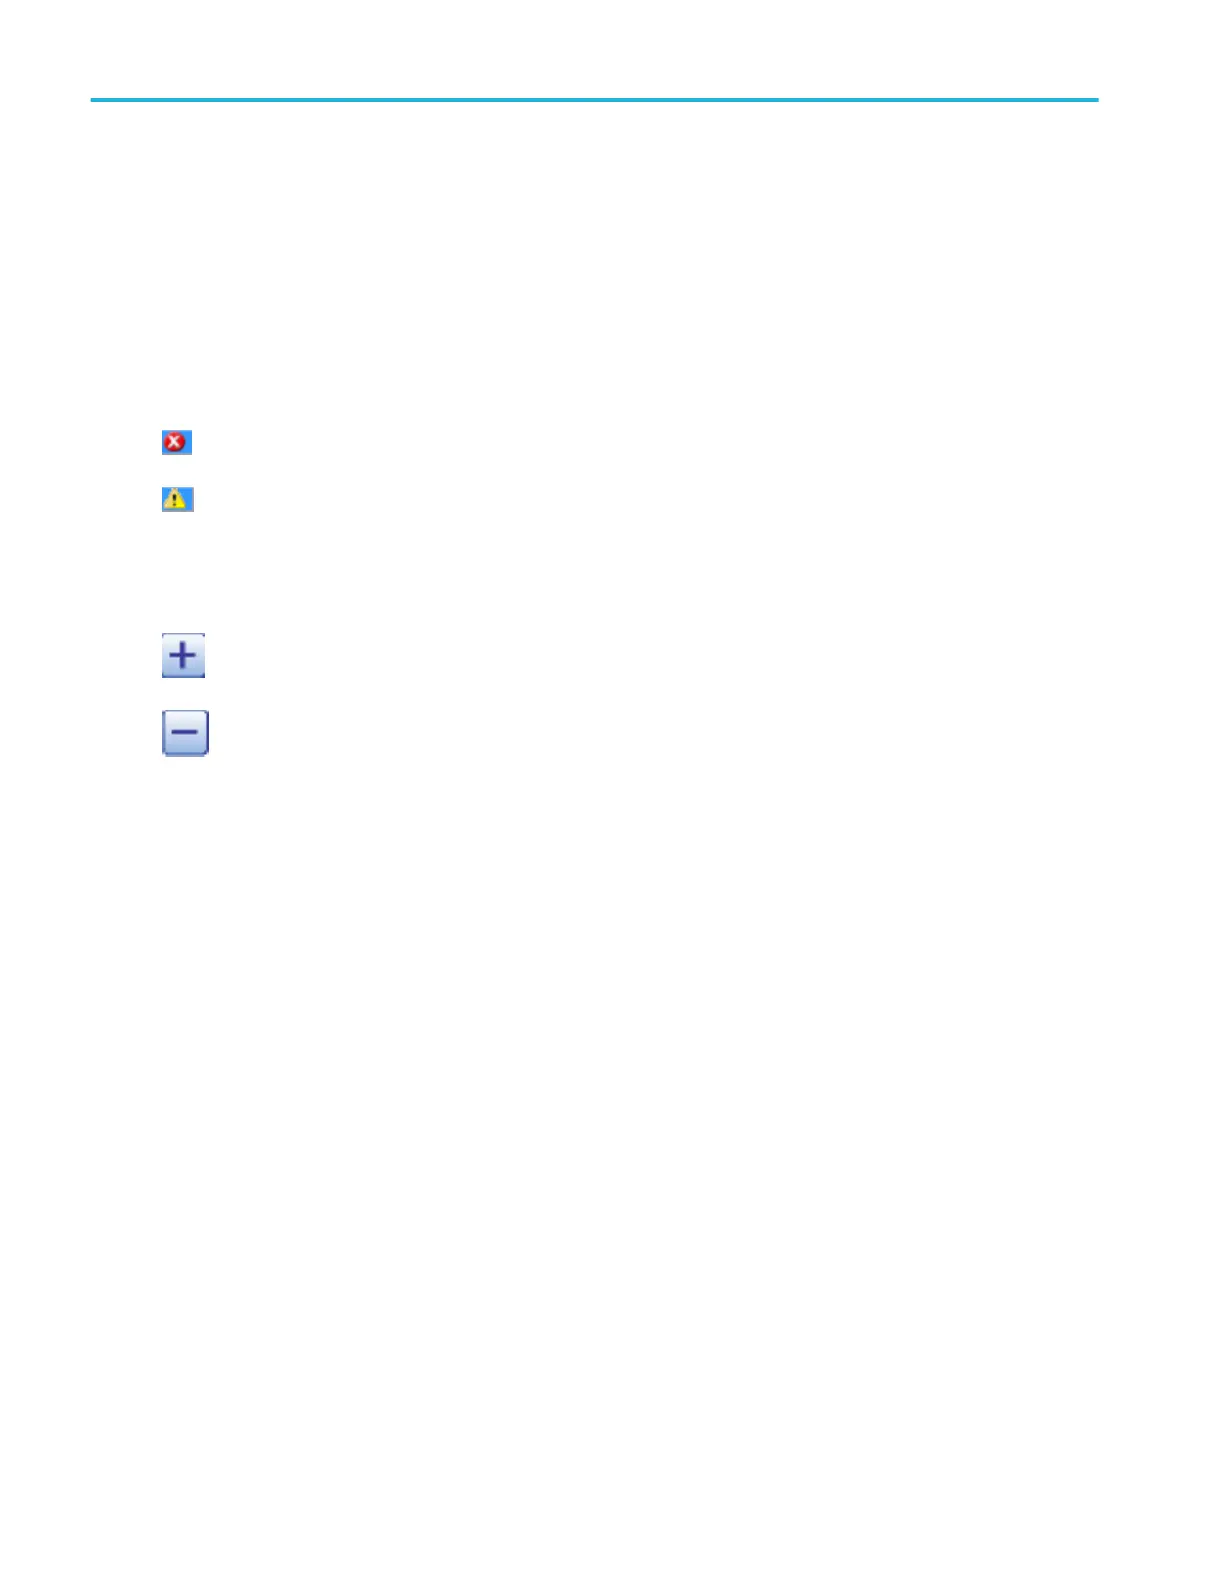
Two types of icons are displayed in the Index column.
An Error/Warning icon is displayed if the packet contains an error (red X) or warning (yellow triangle).
If the packet row or bus column contains collapsed detail, the Expand icon (+) is displayed. Click on the icon to expand the detail.
If the detail is expanded, the Collapse icon (–) is displayed. Click on the icon to close the expanded detail.
Results Table data and Waveform Zoom 1 are correlated with each other. Results Table highlights rows that intersect with the
current Waveform Zoom 1, if enabled. Waveform Zoom 1 moves zoom to center around the selected row in the event table.
Dock or undock the results table
To dock or undock the results table to the graticule, press the Dock button.
Analyzing waveforms
364 DPO70000SX, MSO/DPO70000DX, MSO/DPO70000C, DPO7000C, and MSO/DPO5000B Series

 Loading...


