Analyze Wavefor
morTraceData
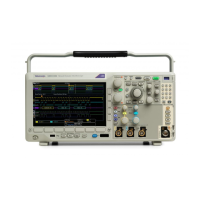
1. The entire acqu
isition is indicated by the
horizontal bar in the upper display.
2. The portion of the acquisition shown in
the time domain graticule is shown w ithi n
the part of the
upper display defined by
the brackets.
NOTE. If you are using the frequency domain and auto-magnify features at the s ame time, and if you m ove the spectrum
time outside of the portion of the acquisition shown in the graticule, then the orange bar in the time-domain display showing
the spectrum time will disappear, as will any activity in the frequency domain display.
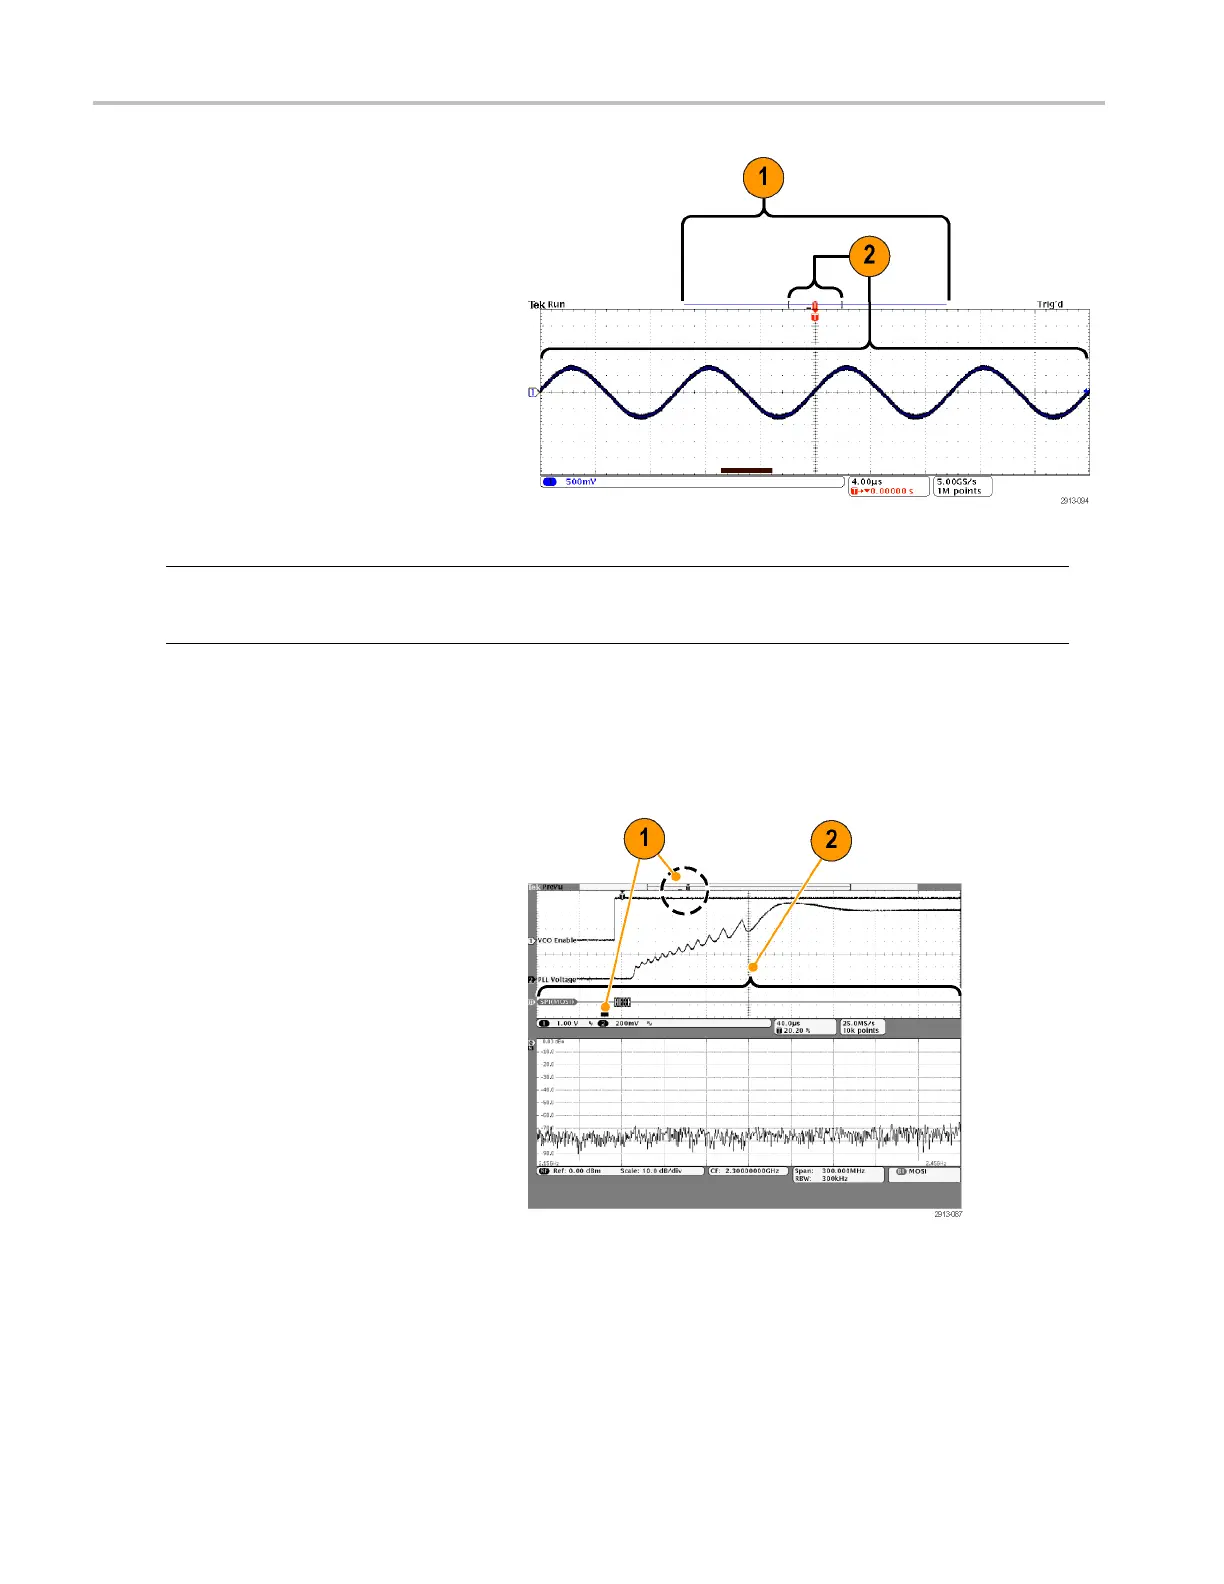
Time-Correlated Multi-Domain Display
A single
trigger event coordinates acquisition across all analog, digital, and RF channels. This enables a time-correlated view
of both the time and frequency domain signals in a single instrument.
1. Spectrum Time: This is the position in
time use
d to calculate the spectrum
shown in the frequency domain graticule.
An orange bar at the bottom of the time
domain
display indicates the Spectrum
Time. The orange bar is also shown in
the acquisition overview at the top of the
displ
ay.
2. Analo
g Time: This is the amount of time
acquired in the time domain graticule.
It is controlled by the Horizontal Scale
knob.
150 MDO4000 Series Oscilloscopes User Manual
 Loading...