www.ti.com
Using the ADS1298ECG-FE Software
21
SBAU171D–May 2010–Revised January 2016
Submit Documentation Feedback
Copyright © 2010–2016, Texas Instruments Incorporated
ADS1298ECG-FE/ADS1198ECG-FE
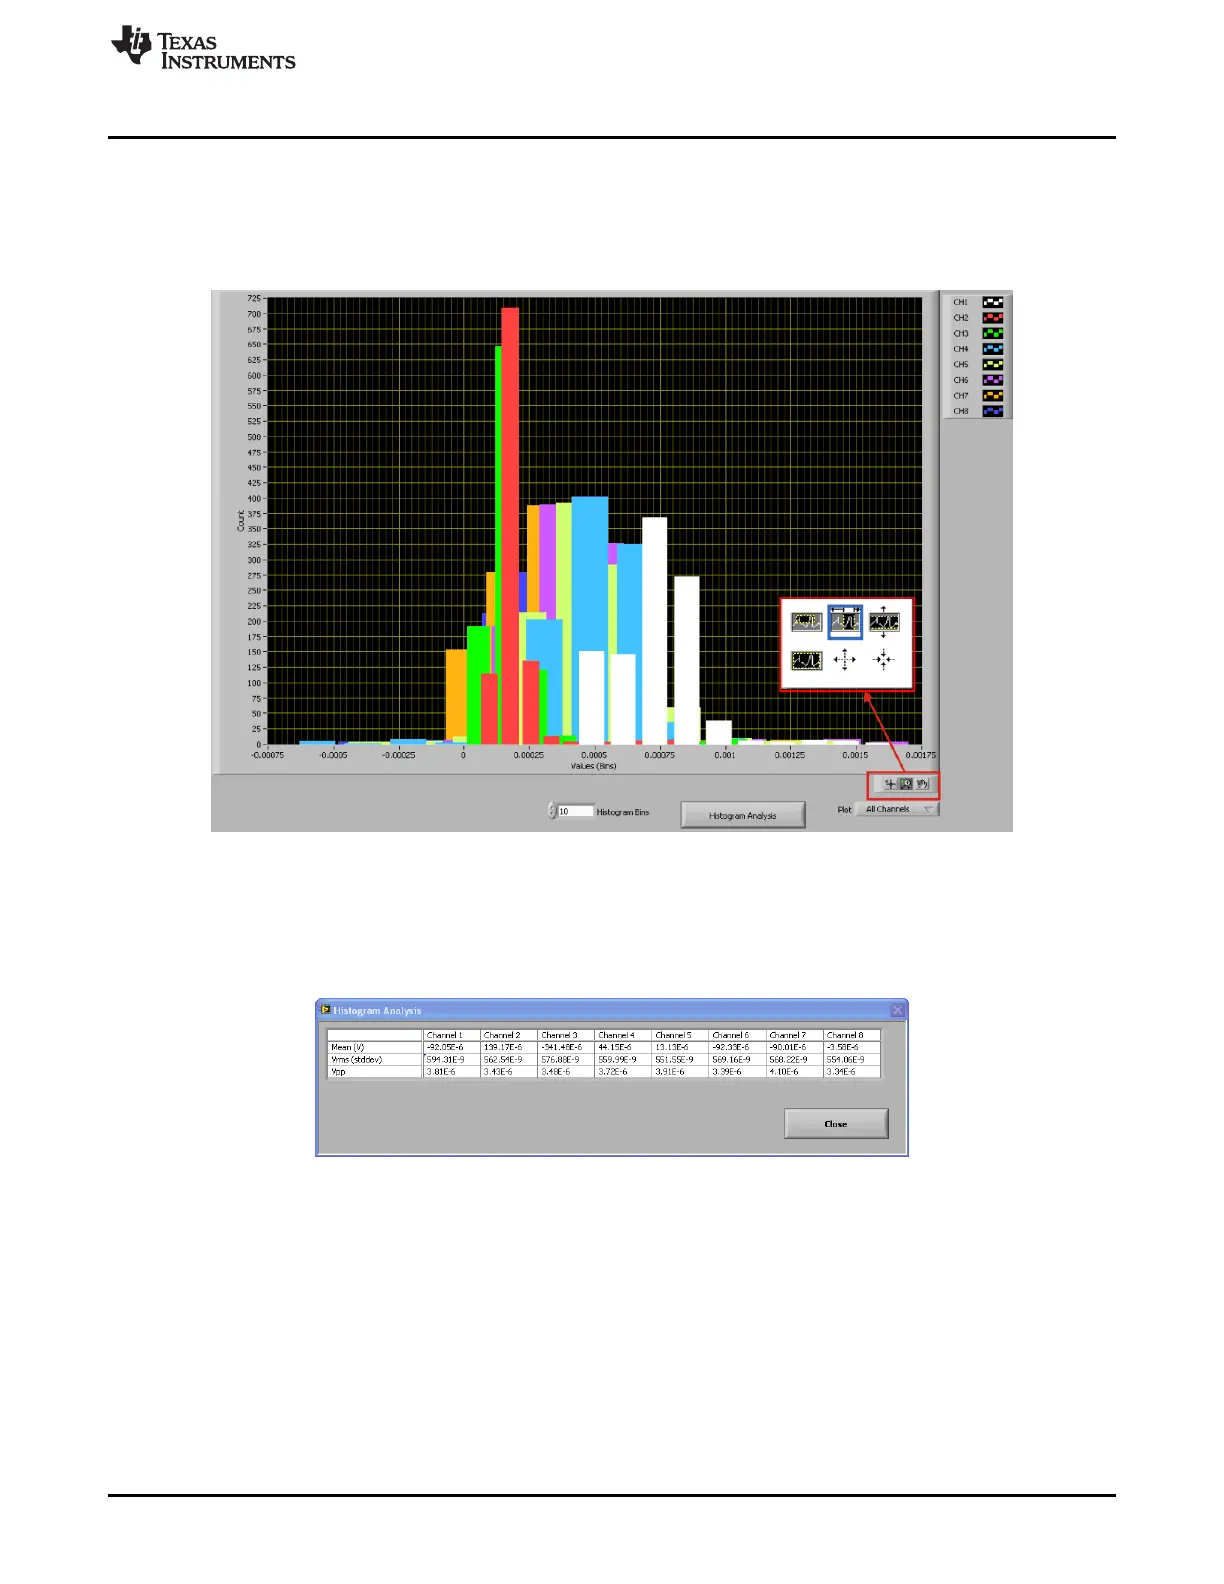
3.5.2 Histogram Tab (Analysis)
The Histogram tool is used primarily to see the bin separation of the different amplitudes of the ECG
waveform harmonics. Figure 20 illustrates the histogram output for a 12-lead signal. The same ECG
Signal Zoom analysis may be used on the histogram plots for a more detailed examination of the
amplitude bins.
Figure 20. Histogram Bins for 12-Lead ECG Signal
Figure 21 shows the Histogram Analysis window that is displayed when the Histogram Analysis button
(at the bottom of the screen in Figure 20) is clicked. The analysis window shows the mean, V
RMS
, and V
PP
channel amplitude bins.
Figure 21. Statistics for the Signal Amplitude of Eight ECG Channels
 Loading...