Chapter 4, Accu-Chek Report
Accu-Chek Smart Pix user's manual
4-7
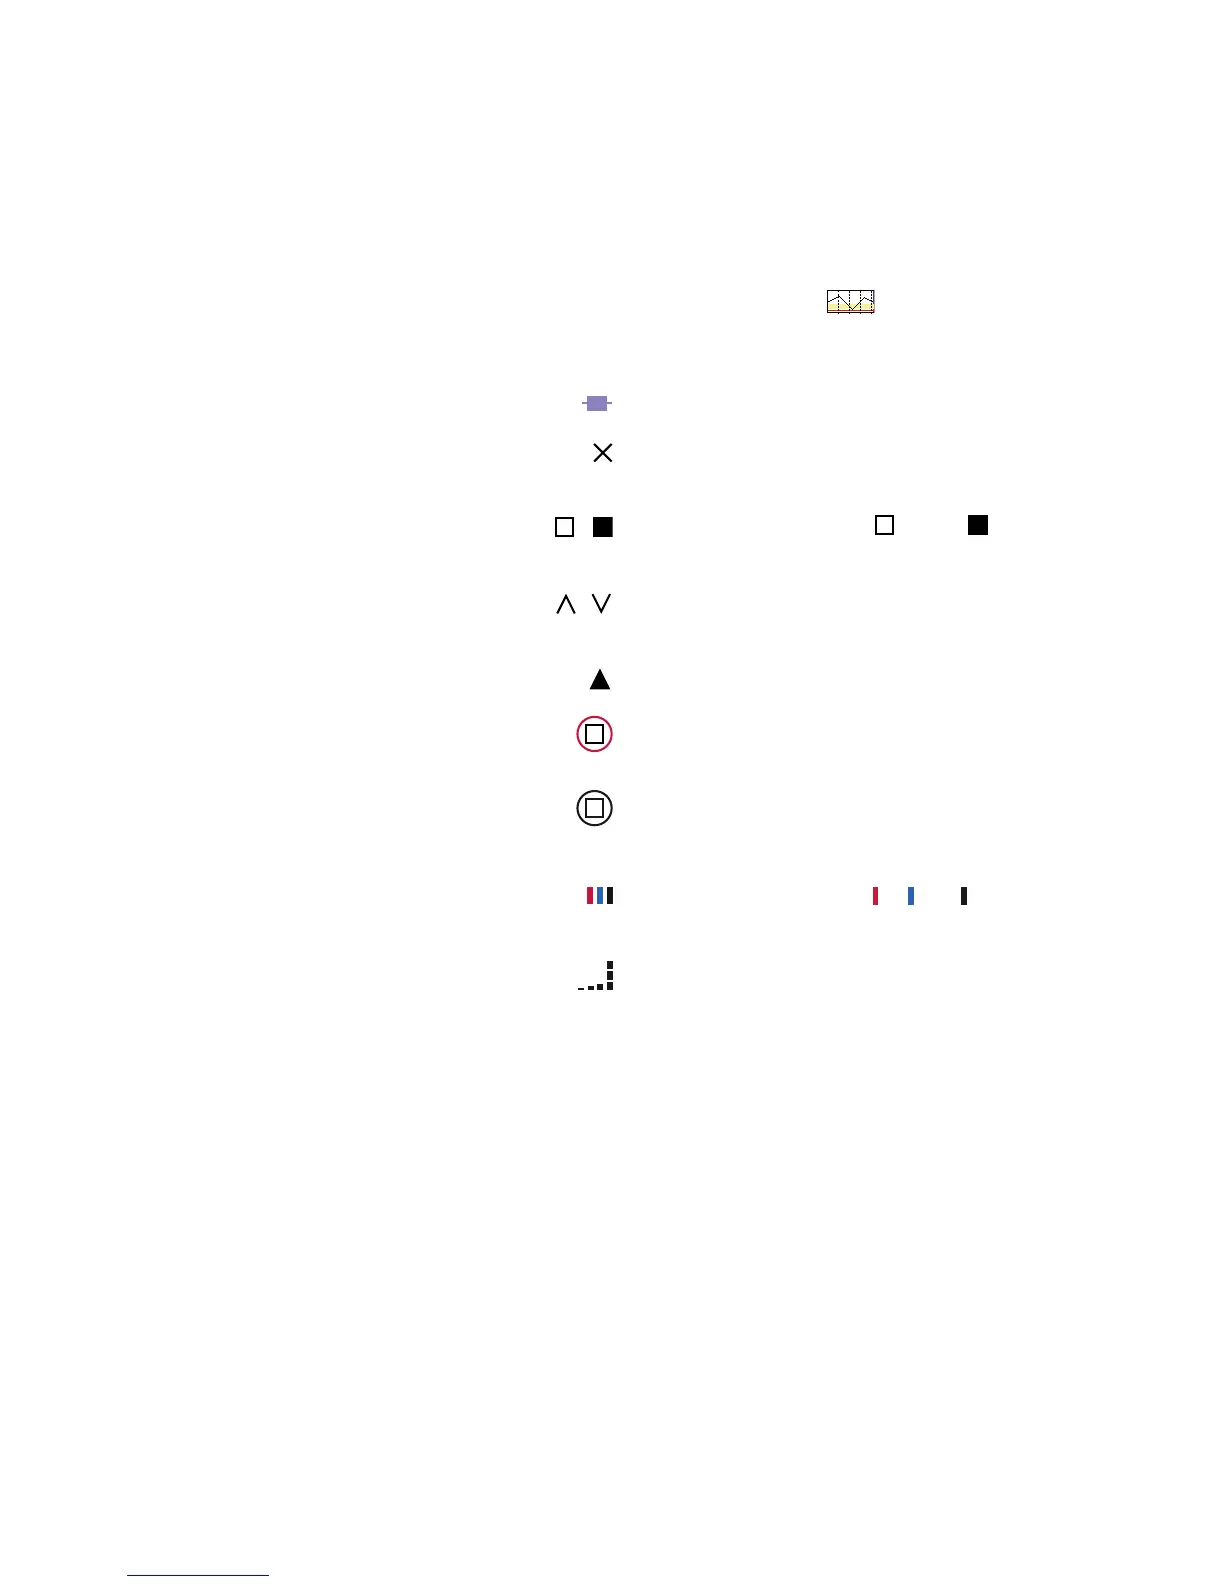
Symbols
(Detailed)
Test results are plotted on
the analysis using various symbols that give additional
information:
Mean value for the respective time interval.
Blood glucose result without any additional information.
Results below the hypo limit are shown in red.
Blood glucose result before or after meal. Results
below the hypo limit are shown in red.
Result outside the measuring range (indicated on the meter
as HI or LO)
Blood glucose result above 400 mg/dL or 25 mmol/L.
Blood glucose result (any symbol inside the red circle)
accompanied by hypo(glycemic) symptoms.
Blood glucose result (any symbol inside the black circle) with
a user-defined event (marked with an asterisk * on the blood
glucose meter).
Insulin amount for insulin 1 , 2 or 3 respectively. Insulin
amounts are plotted on the chart from the top downwards.
Carbohydrate amounts; represented at the lower edge in
some analyses. The carbohydrate amount is indicated by the
height of the single block (or the bar, which consists of
several blocks). The bars shown in this illustration (from left
to right) represent the following amounts:
– Block 1: 2.5 g
– Block 2: 5.0 g
– Block 3: 7.5 g
– Bar 4 (3 blocks of 10 g each): 30 g
 Loading...