16.4 Time Only Instructions: 1 Series
16.4.1 Determining a Treatment Time
When using time as a dose, there are two treatment methods that can be used. The simplest is to
start at a prescribed time and then increase treatment times by a specific time increment or by a
percentage, per your physician’s protocol. Another method is to use the factory power output
levels (shown on the Power Output Certificate) to determine estimated “time equivalents”
needed to deliver doses in millijoules (UVB) or Joules (UVA or visible light).
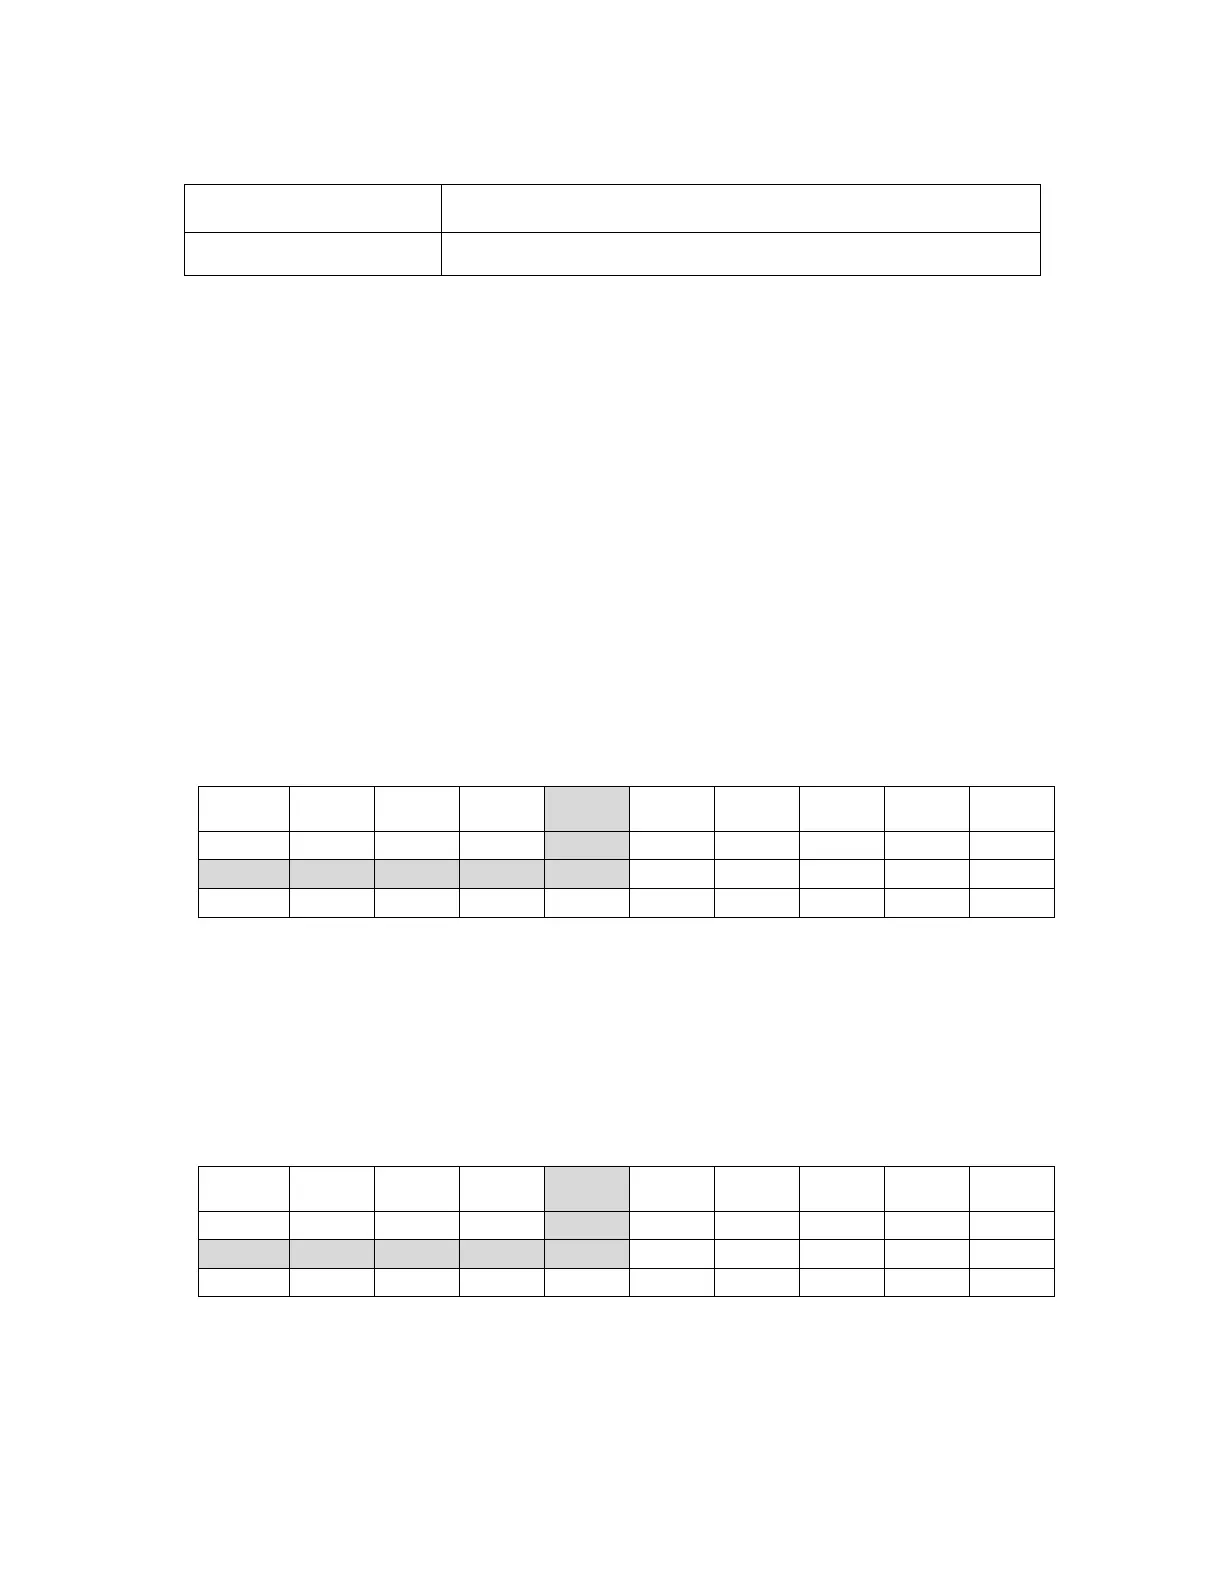
To determine a “time equivalent”, consult the laminated Time Chart that is provided and find the
power output on the top row (horizontal axis). The numbers in the column on the left (vertical
axis) represent a range of potential treatment doses. Find the dose then trace that row to the right
until it intersects with the column corresponding to the factory power output of the device. The
time equivalent is shown where the two lines intersect. For example, if the factory power output
is 4.0 mW/cm2 and the dose to be delivered is 280 mJ, then the appropriate treatment time will
be 01:10. A partial time chart illustrating this is shown in “
Table 4 Partial UVB Time Chart” below.
Note: For your convenience, and as an alternative to the UVB time chart, the latest version of
our free iPhone and Android application “Phototherapy Math” is available for download at the
iTunes app store and Android market. It quickly calculates treatment times, backup safety times,
and makes the calculation of dose and time increases simple. If using a PC, visit
www.phototherapymath.com for a web-based calculator and additional information.
Table 4 Partial UVB Time Chart
The UVA Time Chart (not shown here) is configured the same as the UVB Time Chart however
the doses are listed in Joules and the energy output levels and times are different than the UVB
output levels. Each chart is clearly marked.
 Loading...