
Do you have a question about the Fluke etherscope II and is the answer not in the manual?
| Display | Color LCD |
|---|---|
| Power over Ethernet (PoE) Testing | Yes |
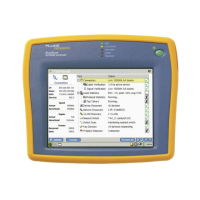
| Model | EtherScope II |
| Type | Network Analyzer |
| Device Type | Handheld Network Analyzer |
| Connectivity | Ethernet |
| Network Interfaces | 10/100/1000 Ethernet |
| Protocols Supported | TCP/IP |
| Features | Network discovery, cable testing |
| Cable Tests | Wiremap, Length |
| Operating Temperature | 0°C to 50°C |
| Storage Temperature | -20°C to 60°C (-4°F to 140°F) |
| Dimensions | 9.5 in x 2.5 in |
Introduces the EtherScope, its features, models, options, and package contents.
Covers safety information, registration, instrument power, and interface selection.
Details screen adjustments, time/date setting, software updates, and power management.
Identifies physical components, ports, and connection interfaces on the instrument.
Explains status LEDs and guides for navigating the touch-sensitive user interface.
Steps for connecting to a wired network and viewing autotest results.
Details Connection Test, Cable Verification, and Signal Verification procedures.
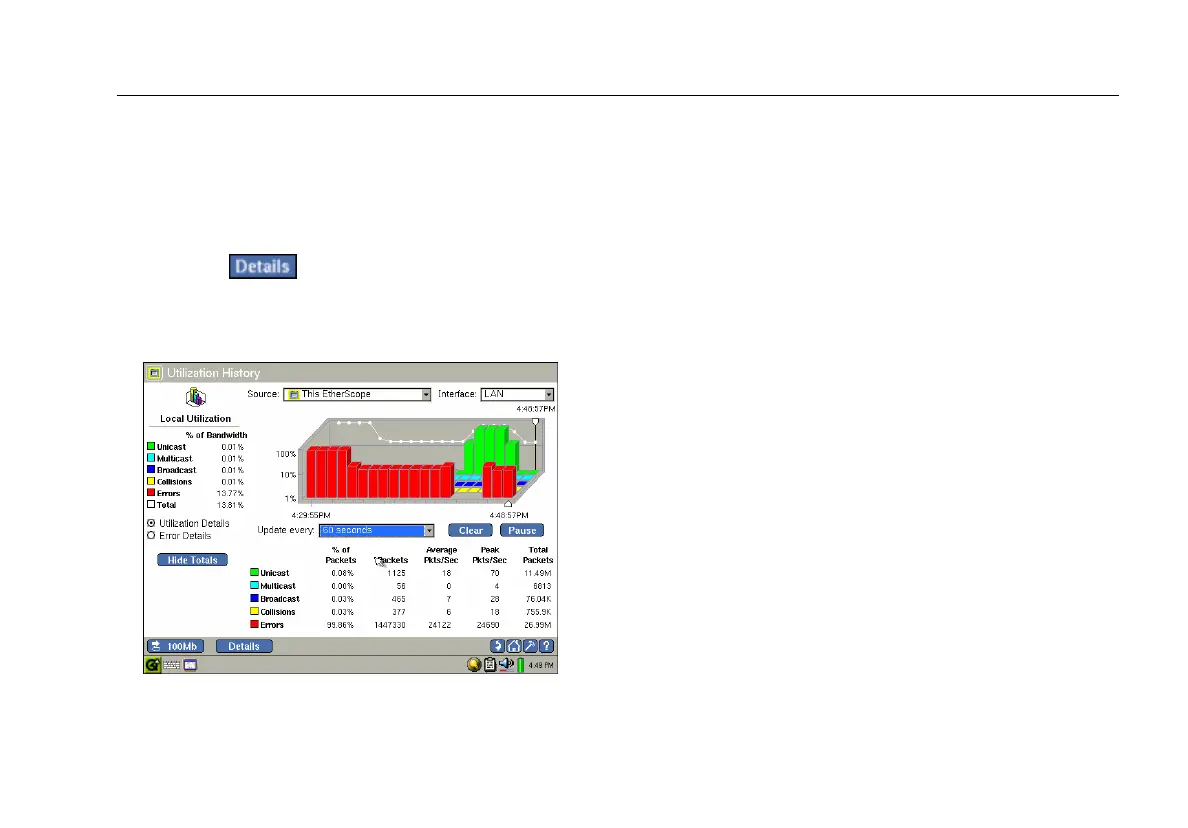
Reports local/remote bandwidth utilization, errors, and discovers network devices and segments.
Covers Problem Detection, RFC 2544 tests, and network security configurations.
Guides on configuring TCP/IP, 802.1Q/IP TOS, and 802.1X settings for wired networks.
Covers installing the WLAN card and basic connection procedures.
Scans 802.11a/b/g spectrum to locate active channels and devices.
Identifies top talkers, devices, and scans for security issues.
Covers documenting networks, saving, managing, and viewing reports.
Explains diagnostic tests (Ping, Trace Route) and remote access methods.
Provides solutions for common instrument problems and operational issues.
Lists detailed technical specifications including weight, dimensions, display, and battery.
Details supported cable types, length accuracy, and signal specifications.