4-20
Using the HP Web Browser Interface
Status Reporting Features
Using the HP Web Browser
Interface
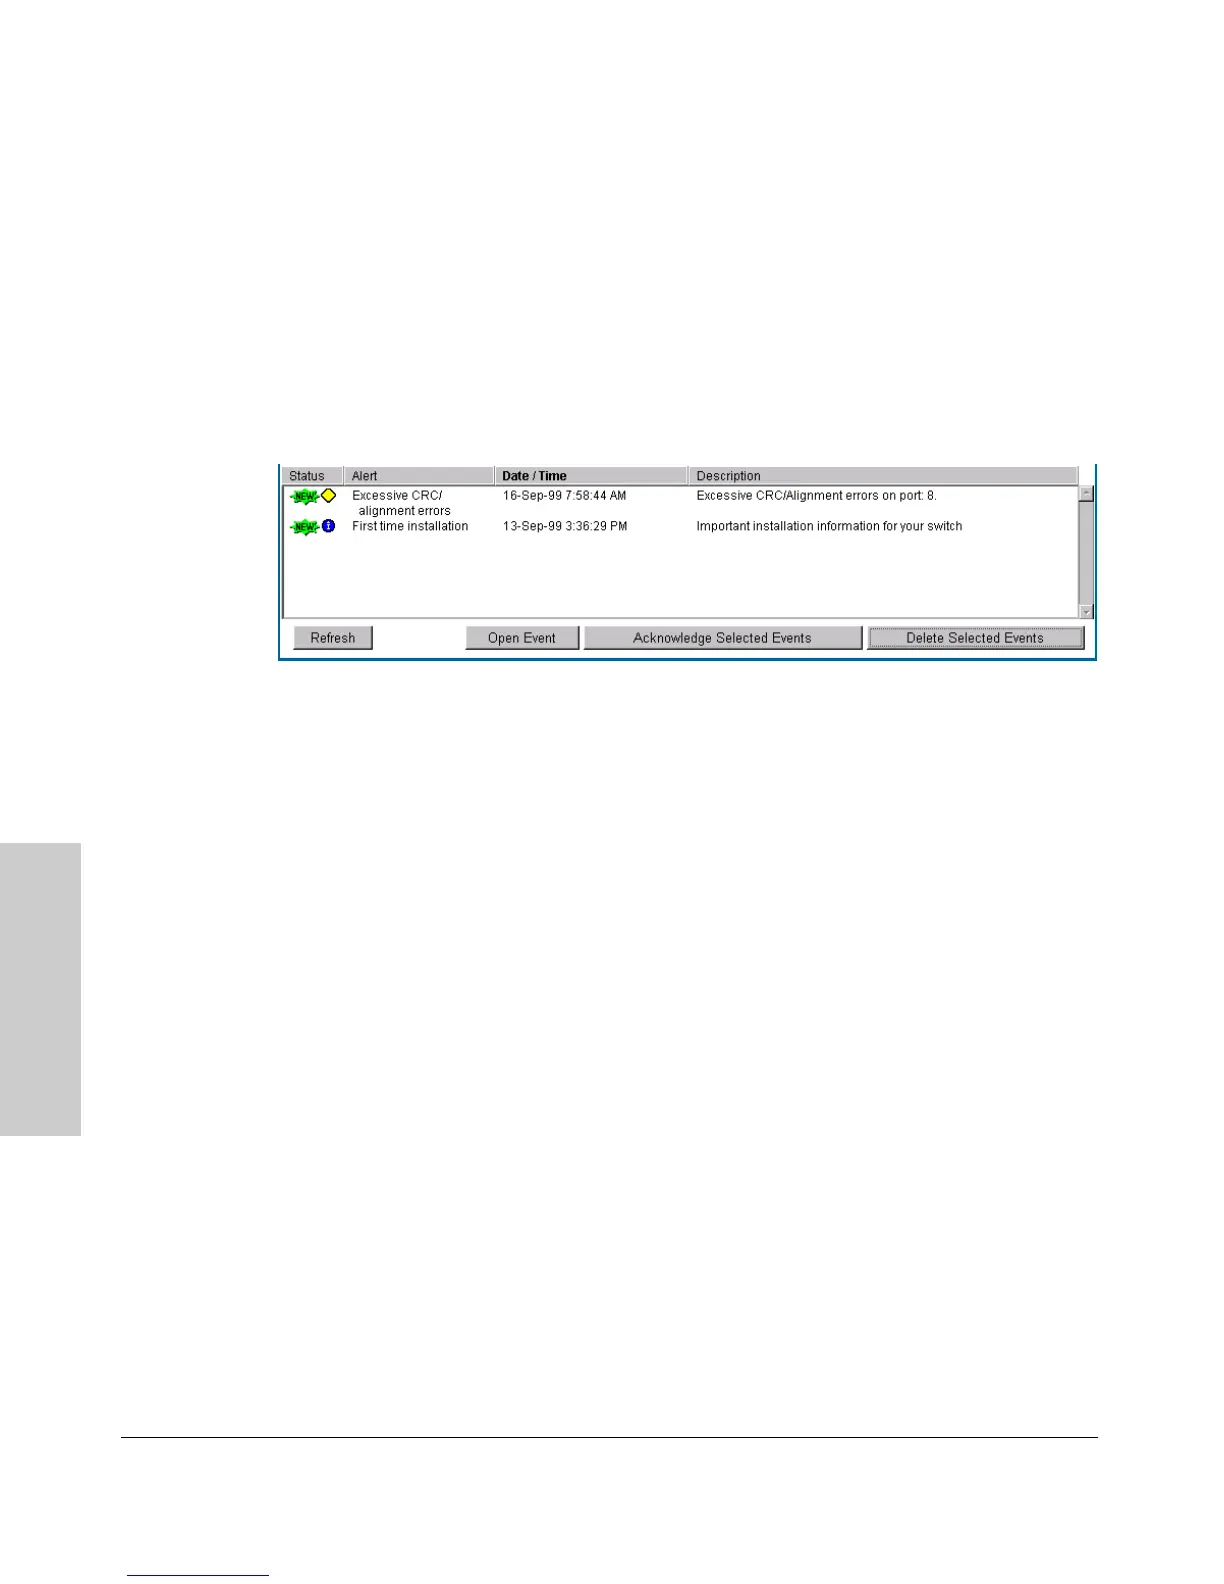
The Alert Log
The web browser interface Alert Log, shown in the lower half of the screen,
shows a list of network occurrences, or alerts, that were detected by the
switch. Typical alerts are Broadcast Storm, indicating an excessive number of
broadcasts received on a port, and Problem Cable, indicating a faulty cable. A
full list of alerts is shown in the table on page 4-21.
Figure 4-13. Example of the Alert Log
Each alert has the following fields of information:
■ Status – The level of severity of the event generated. Severity levels can
be Information, Normal, Warning, and Critical. If the alert is new (has not
yet been acknowledged), the New symbol is also in the Status column.
■ Alert – The specific event identification.
■ Date/Time – The date and time the event was received by the web
browser interface. This value is shown in the format: DD-MM-YY
HH:MM:SS AM/PM, for example, 16-Sep-99 7:58:44 AM.
■ Description – A short narrative statement that describes the event. For
example, Excessive CRC/Alignment errors on port: 8.
Sorting the Alert Log Entries
The alerts are sorted, by default, by the Date/Time field with the most recent
alert listed at the top of the list. The second most recent alert is displayed
below the top alert and so on. If alerts occurred at the same time, the
simultaneous alerts are sorted by order in which they appear in the MIB.
The alert field that is being used to sort the alert log is indicated by which
column heading is in bold. You can sort by any of the other columns by clicking
on the column heading. The Alert and Description columns are sorted alpha-
betically, while the Status column is sorted by severity type, with more critical
severity indicators appearing above less critical indicators.
 Loading...