D-0120588-B – 2019/03
Eclipse – Instructions for Use - EN Page 112
9.8 Making an ASSR recording
9.8.1 Start & stop
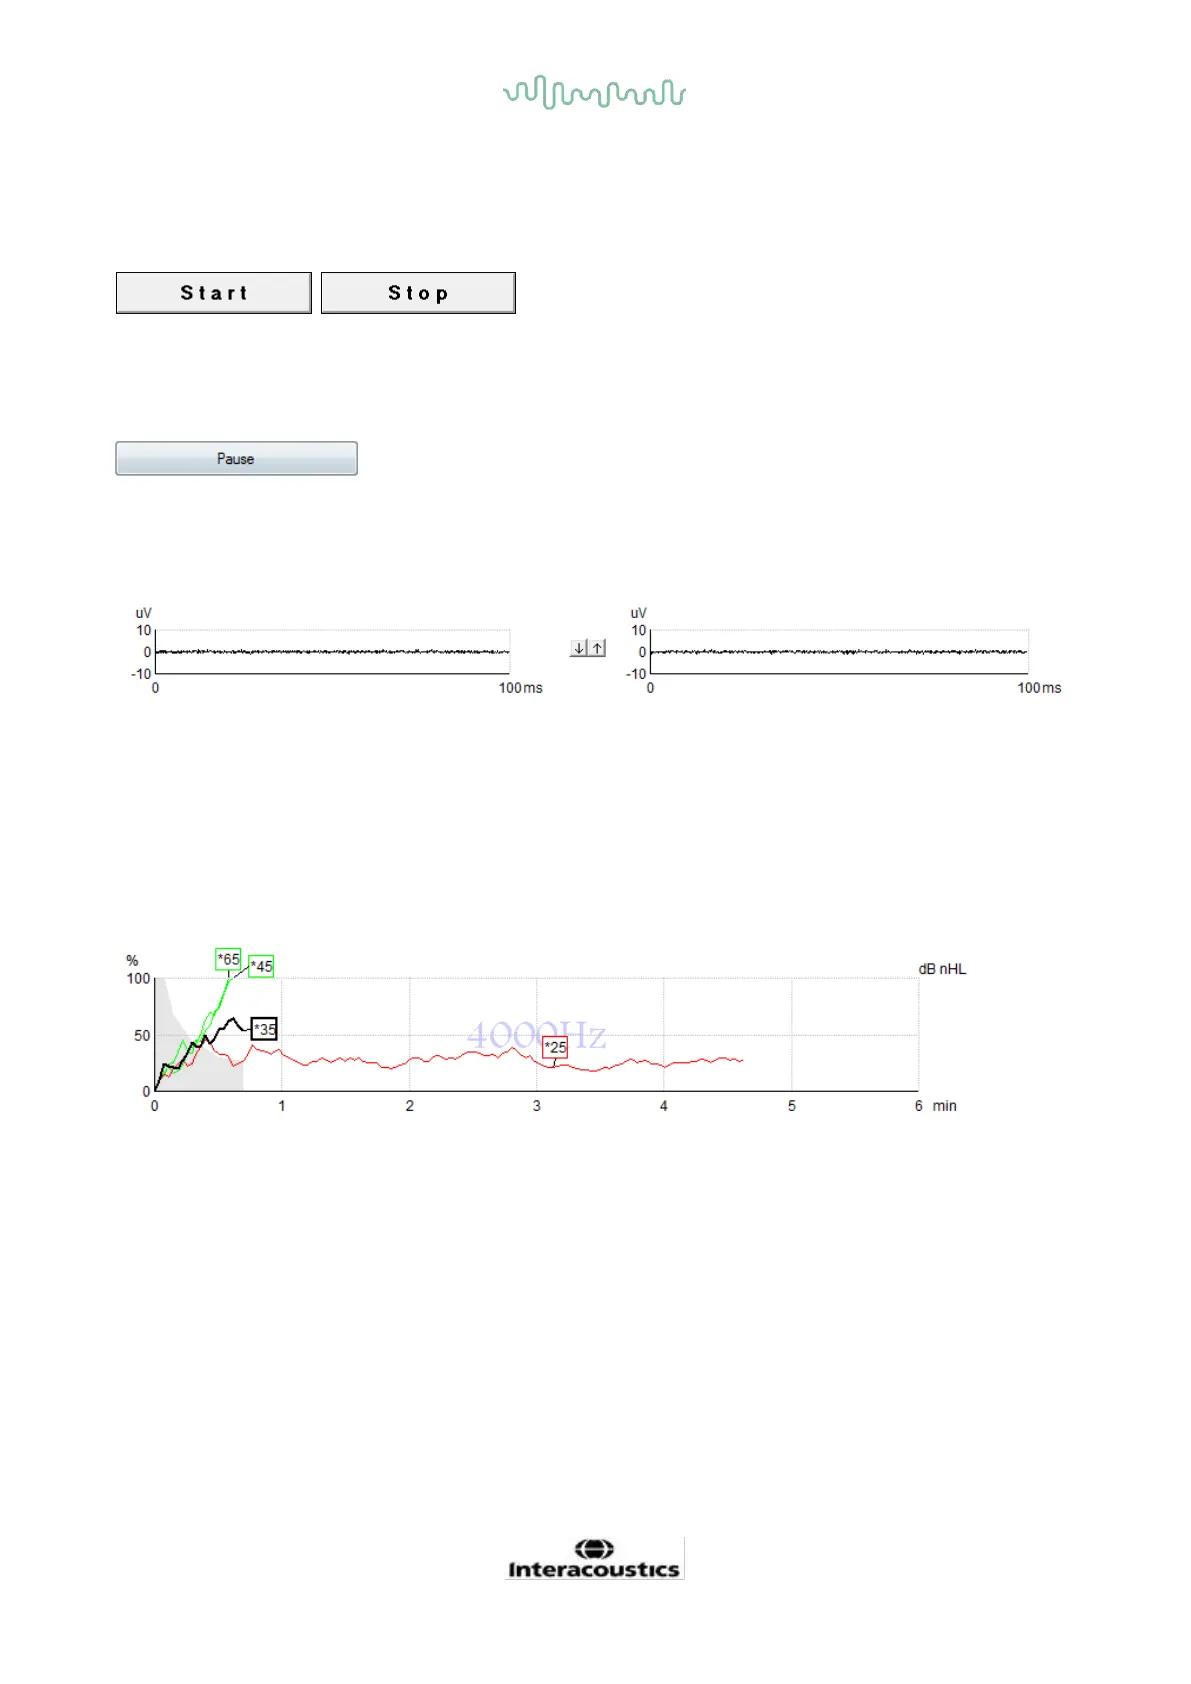
Start and Stop button are used for starting and stopping the measurement. Start button changes into a Stop
button when a recording is started. The Start button will be greyed out if no test stimuli are selected.
9.8.2 Pause
Pause becomes active after testing has started. It allows for pausing during a test. The stimulus will
continue to be presented, but no measurement is occurring. Click on Resume to resume testing.
9.8.3 Raw EEG graphs
The Raw EEG graphs for Right and Left ears indicate the ongoing raw EEG. When the curves are black, the
EEG is within the set rejection level. When the curves turn red, the recorded response will be rejected as the
EEG exceeds the set rejection limits.
The rejection levels can be adjusted by clicking on the arrows between the two raw EEG curve graphs.
During testing the rejection level can only be adjusted within certain limits. To change the rejection level
outside these limits, the test must be stopped.
9.8.4 Test frequency graph
The graph shows an indication of the ongoing or completed results for the specified stimuli.
1. The grey area behind the detection curves indicates the residual noise level for the selected curve.
Exact values are displayed in the ASSR table below the graphs.
2. A black detection curve indicates an ongoing recording.
3. A green detection curve indicates that detection at the specified level has been detected.
4. A red detection curve is displayed when a test has timed out and has not reached 100% detection
or has been stopped prior to reaching detection or test time limits.
5. The curve handle indicates the testing intensity and stimulus rate. An asterisk (*) in front of the
stimulus level indicates a 40Hz stimulus rate was used.
Select a detection curve by clicking on the handle. The selected curve handle will be presented in bold.
 Loading...