D-0120588-B – 2019/03
Eclipse – Instructions for Use - EN Page 26
The efficiency of the method used for determining the residual noise level is described in the following article:
Elberling, C., & Don, M. (1984). Quality estimation of average auditory brainstem responses. Scand Audiol,
13, 187-197.
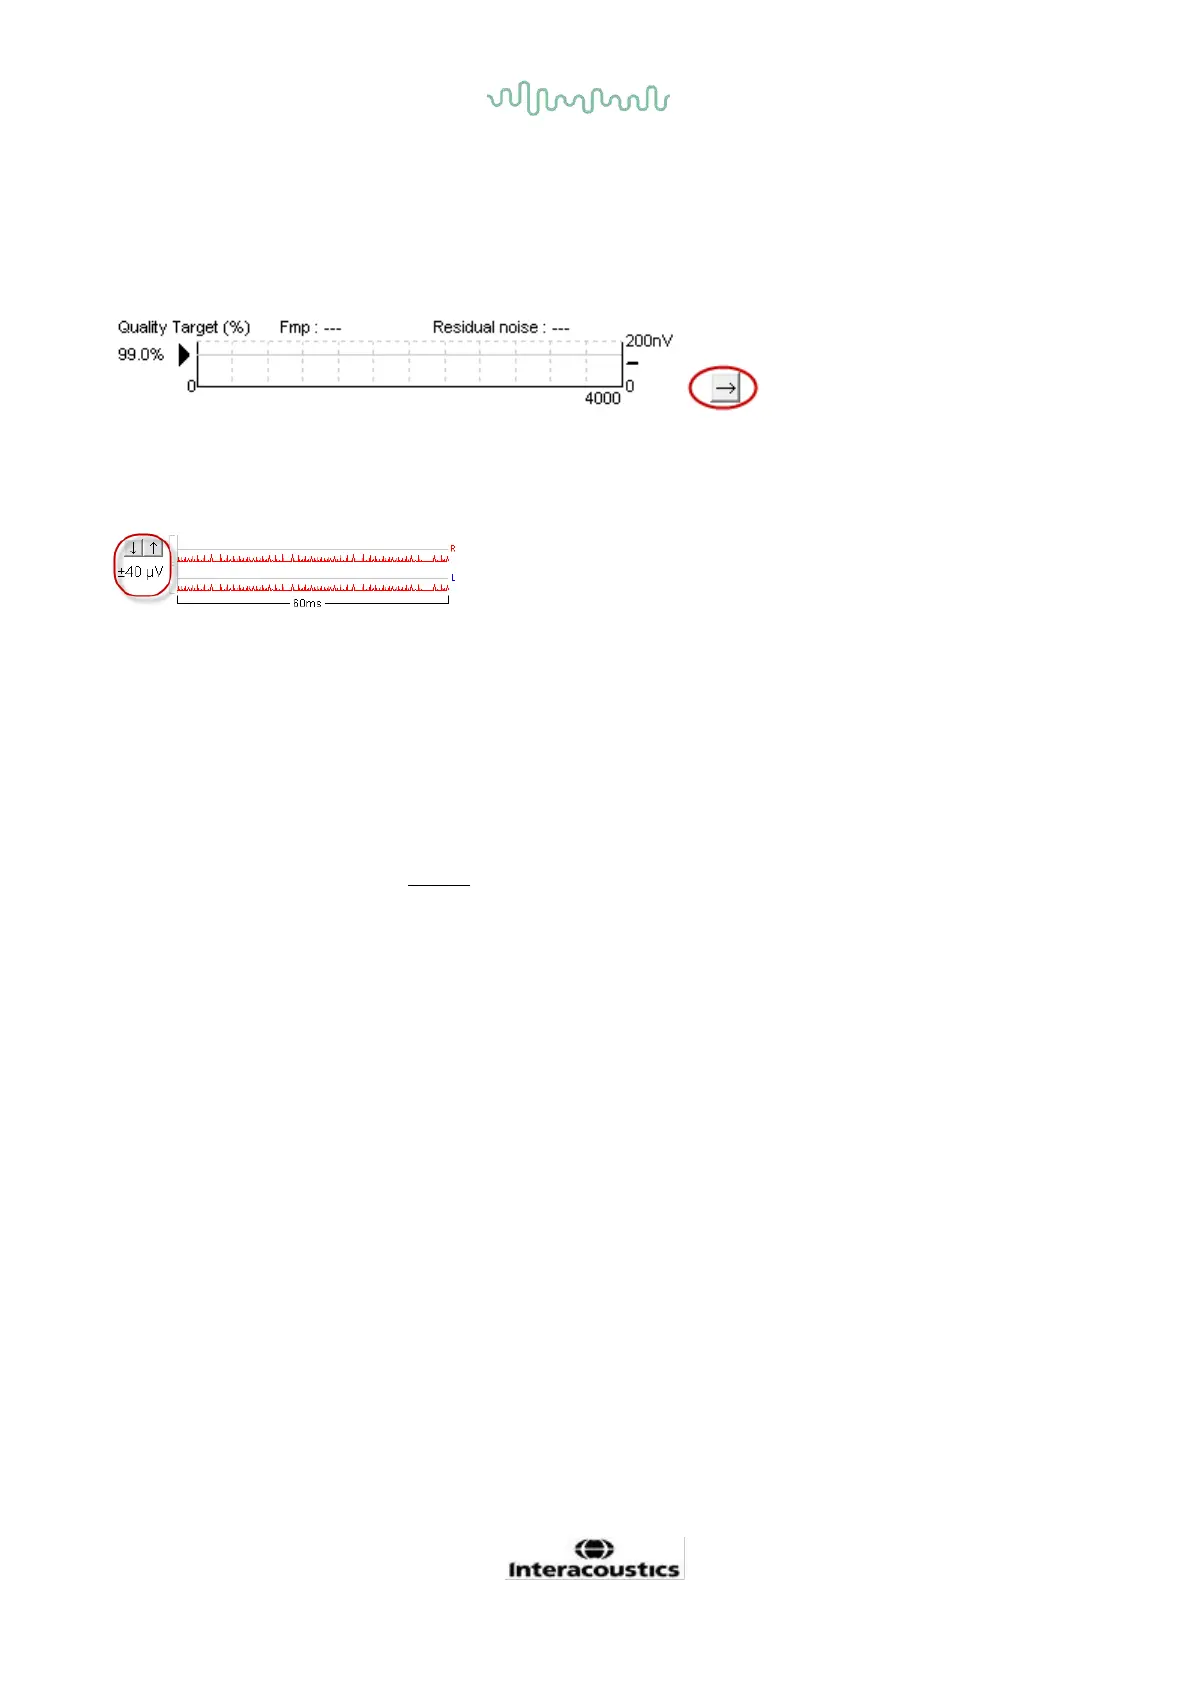
3.1.27 Extending the number of sweeps/averages
Click on the arrow next to the Fmp & Residual Noise Graph to extend the number of sweeps during testing.
3.1.28 Raw EEG
The Raw EEG graph indicates the ongoing raw EEG. When the curves are black, the raw EEG is within the
set rejection level. When the curves turn red, the recorded response will be rejected as the raw EEG
exceeds the set rejection limits.
The rejection level can be adjusted by clicking on the arrows to the left of the raw EEG curve. The arrows
are hidden during testing and the rejection level cannot be changed from here.
3.1.29 Advanced EEG
Double click on the Raw EEG graph to open the Advanced EEG graph.
1. Adjust the rejection level display using the arrows.
2. The grey area indicates the area where rejection has been disabled.
3. The white area indicates the area where rejection may occur.
Drag the dotted vertical line and specify the time range over which normal rejection is applied
4. Drag the dotted horizontal lines to specify the EEG signal peak to peak before rejection occours.
5. Indicates the range over which the Fmp is calculated. Rejection cannot be disabled within this
calculation range.
6. Click on Close to close the Advanced EEG window.
7. To activate the stimulus click Stim @ 0 dB nHL, or press a different level in the control panel left
side.
8. To disable rejection completely.
9. Hide stimulus artefact, when clicked thicker black line appears as the waveform start. Change the
timing by using mouse drag on the lines edge. The hide stimulus artefact, shows a flat line, and e.g.
large artefact can be hidden.
10. Center the EEG on the 0uV baseline.
11. Show normal EEG display.
 Loading...