D-0120588-B – 2019/03
Eclipse – Instructions for Use - EN Page 113
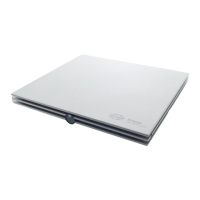
The detection curve handle indicates the stimulus intensity and the stimulation rate (40 or 90Hz). When the
40Hz stimulus rate is used, an asterisk (*) is displayed before the intensity value.
40Hz:
90Hz:
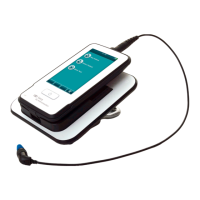
Right click on a curve handle for the following options:
1. Delete the selected curve.
2. Delete all detection curves for the selected frequency.
3. Hide the selected curve. The curve handle will remain on screen to indicate it has been tested and
is available to be un-hidden.
4. Cursor brings forward a cursor that will track with the curve and provide numerical information for
the probability percentage and time at any point of the curve.
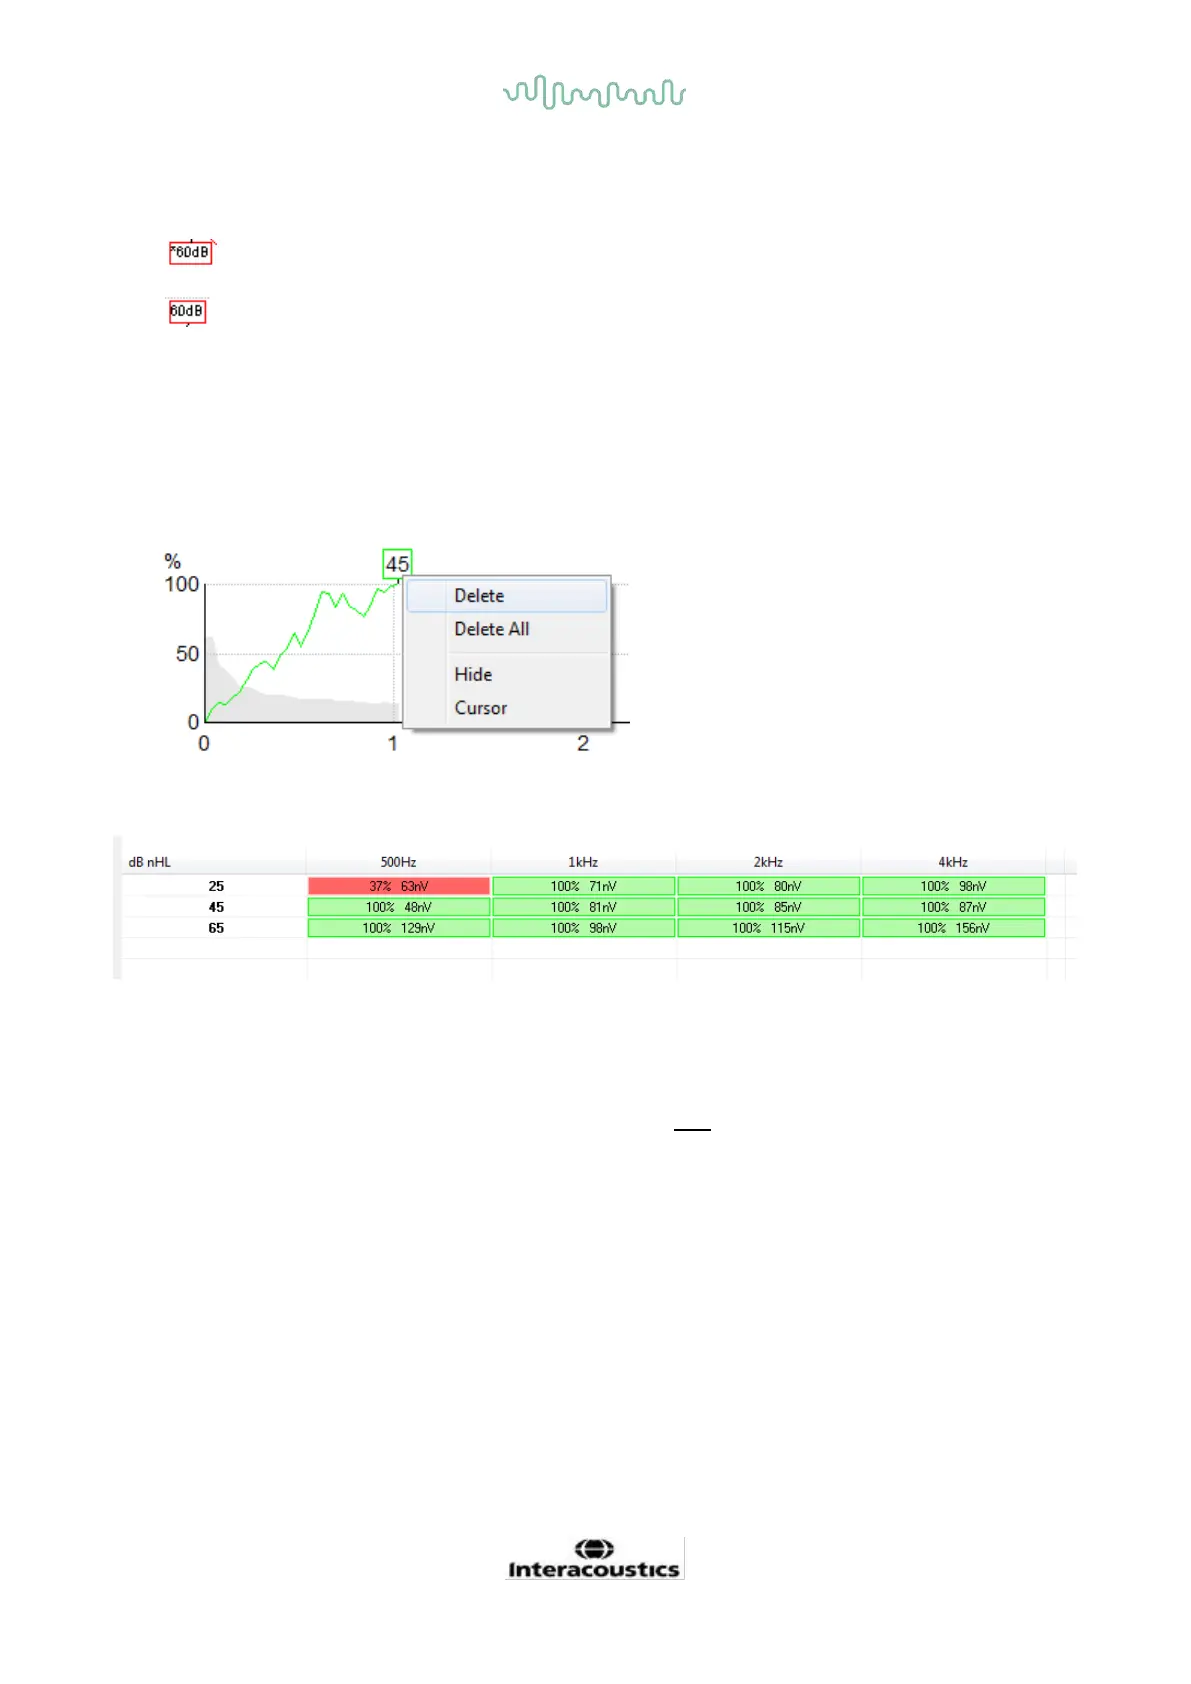
9.8.5 ASSR table
The ASSR table displays the detection curve information in a table format. Each tested frequency and
intensity is shown along with the detection percentage (response probability) and residual noise level in nV.
Green indicates the specific frequency/intensity reached 100% detection, while red indicates 100% detection
was not reached.
If the same intensity is tested more than once, the one with the best response will be shown in the table.
The efficiency of the method used for determining the residual noise level is described in the following article:
Elberling, C., & Don, M. (1984). Quality estimation of average auditory brainstem responses. Scand Audiol,
13, 187-197.
 Loading...