D-0120588-B – 2019/03
Eclipse – Instructions for Use - EN Page 39
3.2.3 Latency graph
A graphical presentation of the marked waveform’s latencies is provided. This allows for an easy
interpretation of latency change relative to the change in stimulus intensity. The grey shaded area indicates
the normative range and will be displayed providing normative latency data has been added in the System
Setup. Gender and age data are taken from the database to provide the selection of the corresponding
normative latency data.
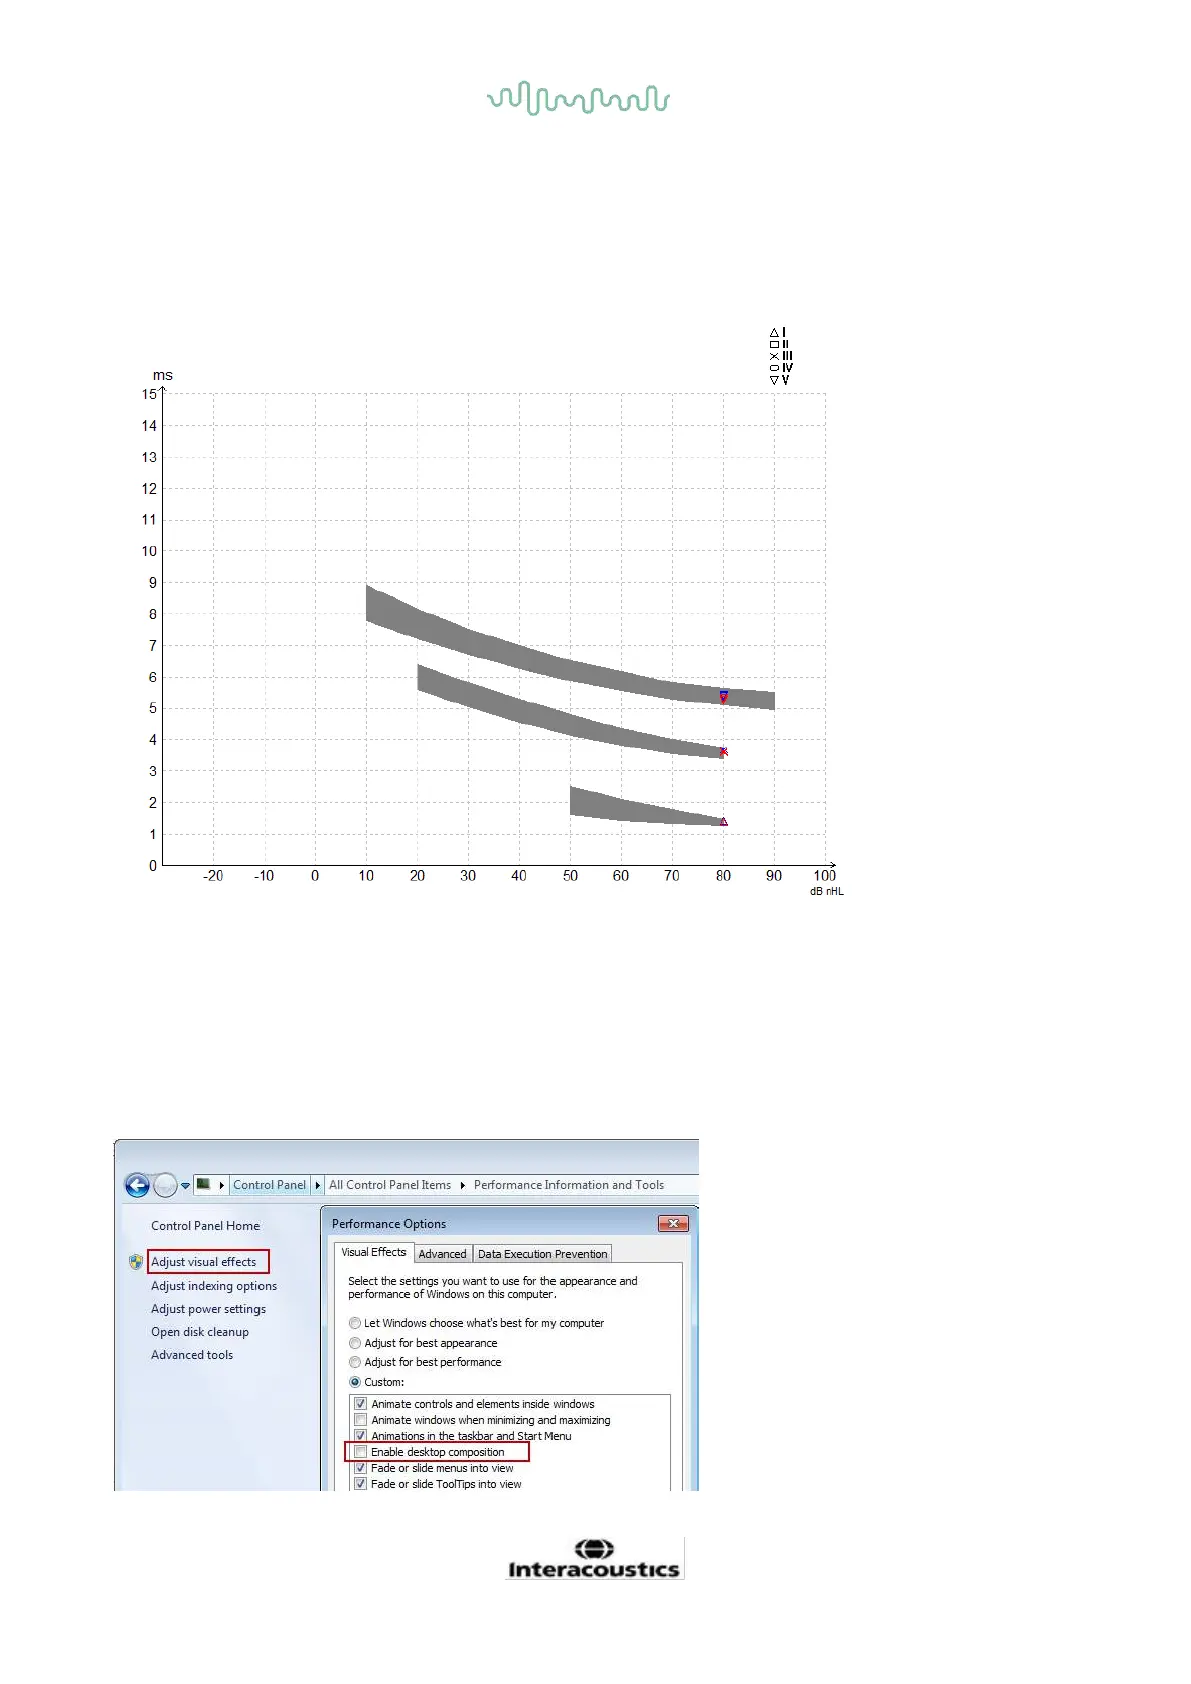
3.2.4 Disabling desktop composition (EPx5 software only)
When running under Windows® 7 the Desktop Composition option should be disabled to avoid slow
movements of the cursor when placing waveform markers in the EPx5 software module.
1. Go to Control Panel
2. Select Performance information and tools
3. Select Adjust visual effects
4. Uncheck the Enable desktop composition box
5. Press OK to save changes.
 Loading...