Phase
difference = Horizontal distance of new sweep range
(div)x45°/div
New
SWEEP
TIME/DIV setting
Original
SWEEP
TIME/DIV setting
Another simple
method
of
obtaining
more accuracy quick-
ly is to simply use x 10 MAG for a
scale
of 4.5°/div.
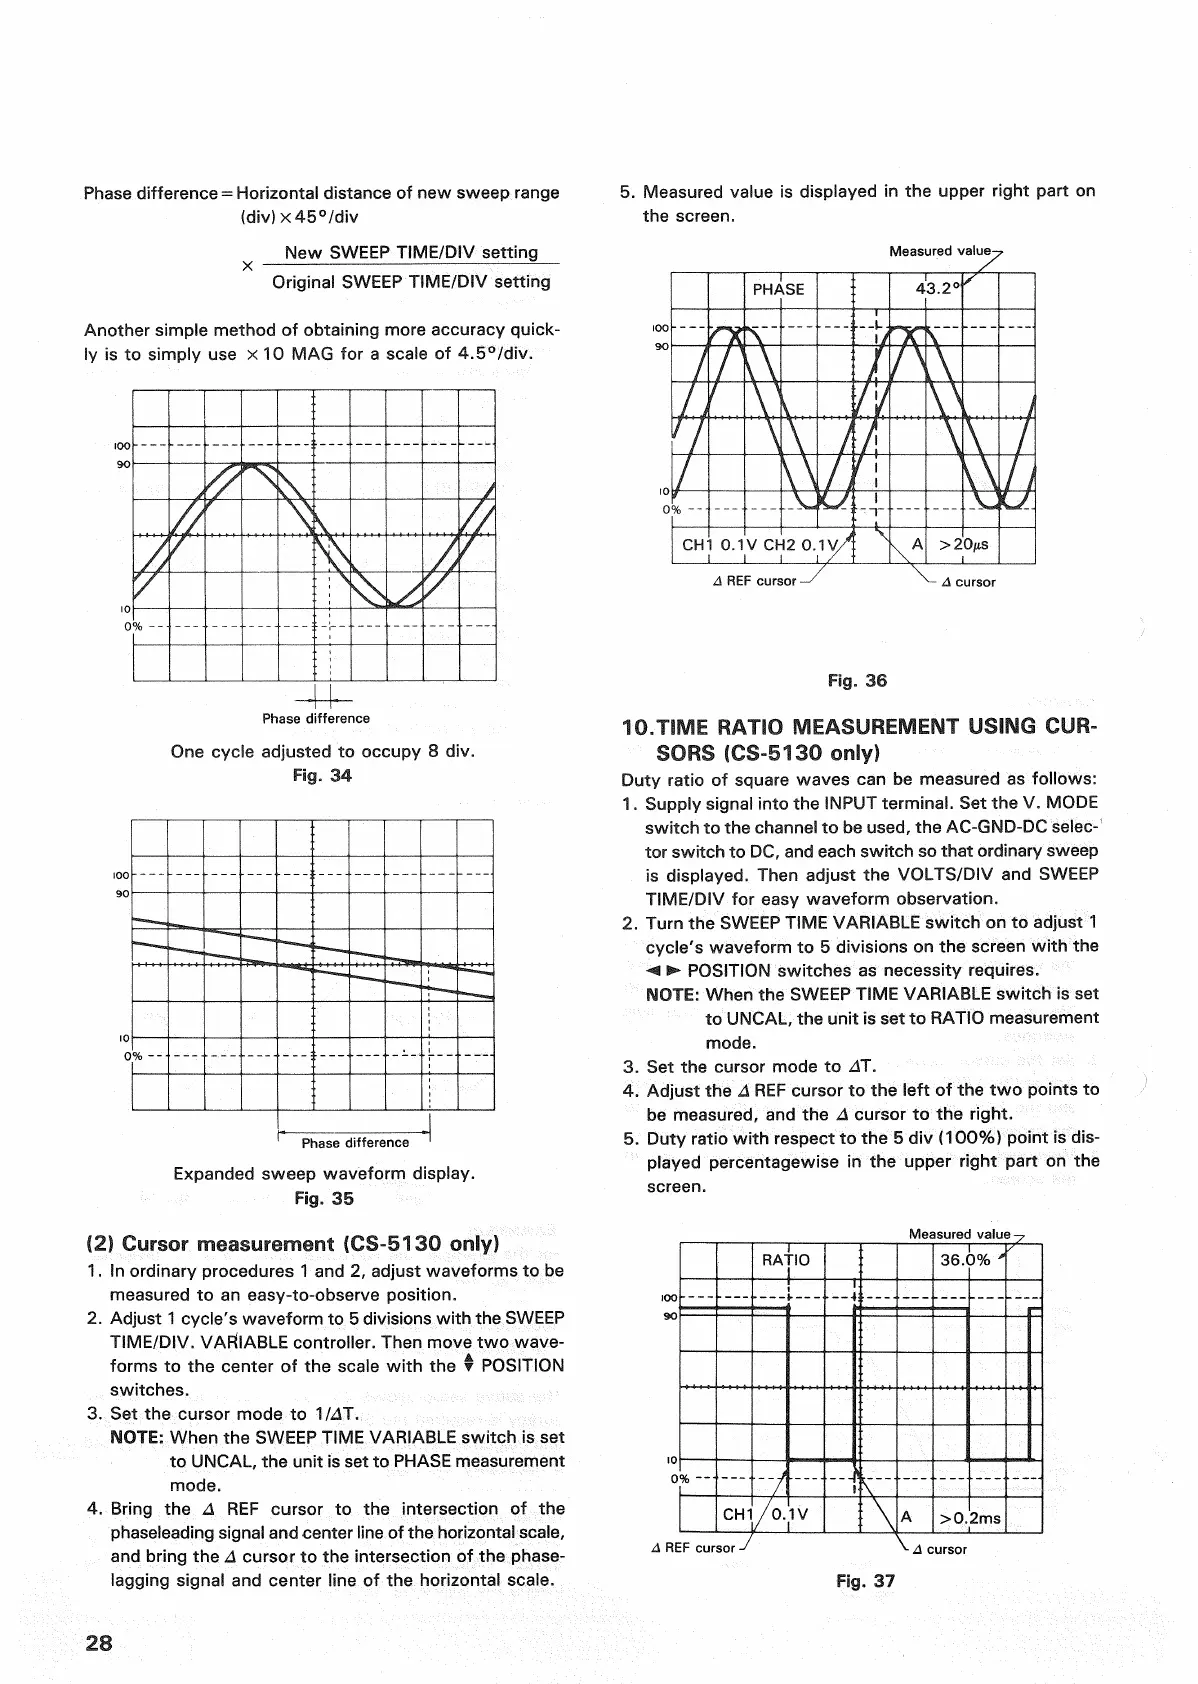
5.
Measured value is displayed in the upper
right
part on
the screen.
Phase
difference
One cycle adjusted to occupy 8 div.
Phase
difference
(2) Cursor measurement {CS-5130 only)
1.
In ordinary procedures 1 and 2, adjust waveforms to be
measured
to an easy-to-observe position.
2.
Adjust 1 cycle's waveform to 5 divisions
with
the
SWEEP
TIME/DIV.
VARIABLE
controller. Then move two wave-
forms to the center of the
scale
with
the •
POSITION
switches.
3.
Set the cursor mode to WAT.
NOTE:
When the
SWEEP
TIME
VARIABLE
switch is set
to UNCAL, the
unit
is set to
PHASE
measurement
mode.
4.
Bring the A REF cursor to the intersection of the
phaseleading signal and center line of the horizontal
scale,
and
bring
the A cursor to the intersection of the phase-
lagging signal and center line of the horizontal
scale.
Measured value
REF
cursor
-
cursor
10.TIME RATIO MEASUREMENT USING CUR-
SORS
(CS-5130 only)
Duty
ratio
of square waves can be measured as follows:
1.
Supply signal
into
the INPUT terminal. Set the V. MODE
switch to the channel to be used, the
AC-GND-DC
selec-
tor switch to DC, and each switch so
that
ordinary sweep
is
displayed. Then adjust the
VOLTS/DIV
and
SWEEP
TIME/DIV
for
easy
waveform observation.
2.
Turn the
SWEEP
TIME
VARIABLE
switch on to adjust 1
cycle's
waveform to 5 divisions on the screen
with
the
^ •
POSITION
switches as necessity requires.
NOTE:
When the
SWEEP
TIME
VARIABLE
switch is set
to UNCAL, the
unit
is set to
RATIO
measurement
mode.
3.
Set the cursor mode to AT.
4.
Adjust the A
REF
cursor to the
left
of the two points to
be measured, and the A cursor to the
right.
5.
Duty
ratio
with
respect to the 5 div (100%)
point
is dis-
played percentagewise in the upper
right
part on the
screen.
REF
cursor
cursor
Fig.
37
28
Fig.
34
Fig.
36
Expanded
sweep waveform display.
Fig.
35
Measured value
 Loading...