14.SWEEP
MULTIPLICATION
(MAGNIFI-
CATION)
The
apparent magnification of the delayed sweep is deter-
mined by the
values
set by the A and B
SWEEP
TIME/DIV
controls.
1.
Apply a signal to the
INPUT
jack and set the vertical
MODE
to the channel to be
used,
adjusting
VOLTS/DIV
for an easily observed display of the waveform and the
other controls if
necessary.
2.
Set the A
SWEEP
TIME/DIV
so that
several
cycles
of the
waveform are displayed.
Depress
the HOLD
OFF
control
to
(AFTER DELAY).
When
the
HORIZ
MODE is set to INT, the magnified
por-
tion
of the waveform will appeared intensified on the
CRT
display.
3.
Use the
DELAY
TIME
MULT to shift the intensified
por-
tion
of waveform to correspond
with
the section to be
magnified for observation. Use the B
SWEEP
TIME/DIV
to adjust intensified
portion
to cover the entire
portion
to be magnified.
4.
Set the
HORIZ
MODE to either ALT or B and use the •
POSITION
and
TRACE
SEPARATION
controls to adjust
the display for
easy
viewing.
5.
Time measurements are performed in the
same
manner
from
the B sweep as was described above for A sweep
time measurements.
The
apparent magnification of the intensified waveform
section
is the A
SWEEP
TIME/DIV
divided by the B
SWEEP
TIME/DIV.
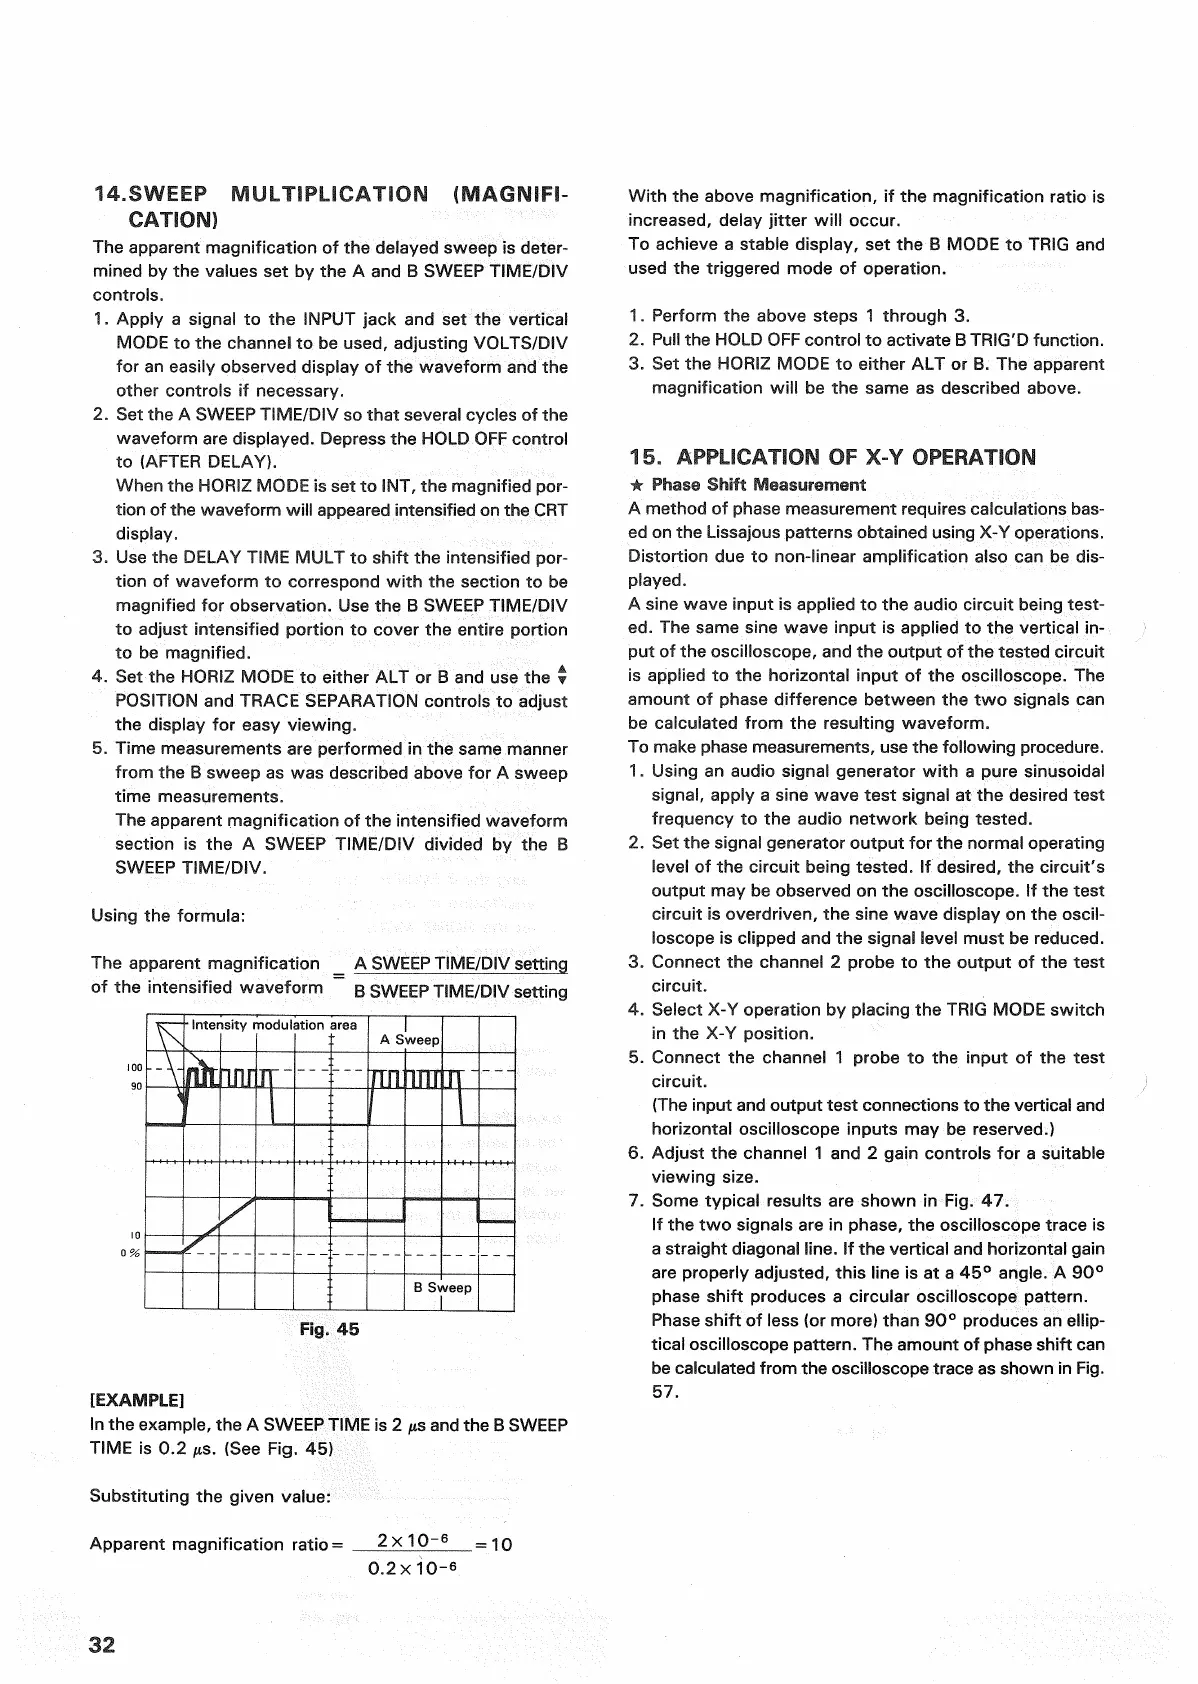
Using
the formula:
The
apparent magnification _ A
SWEEP
TIME/DIV
setting
of the intensified waveform B
SWEEP
TIME/DIV
setting
Fig.
45
[EXAMPLE]
In
the example, the A
SWEEP
TIME
is 2
/xs
and the B
SWEEP
TIME
is 0.2 /is. (See Fig. 45)
Substituting the given value:
Apparent magnification ratio = 2x 10~
6
=10
0.2x10⁻⁶
With the above magnification, if the magnification ratio is
increased,
delay
jitter
will occur.
To
achieve a stable display, set the B MODE to
TRIG
and
used
the triggered mode of operation.
1.
Perform the above steps 1
through
3.
2.
Pull the HOLD
OFF
control to activate B
TRIG'D
function.
3.
Set the
HORIZ
MODE to either ALT or B. The apparent
magnification will be the
same
as described above.
15.
APPLICATION
OF X-Y
OPERATION
•
Phase
Shift Measurement
A
method of phase measurement requires calculations
bas-
ed
on the
Lissajous
patterns obtained using X-Y operations.
Distortion due to non-linear amplification also can be dis-
played.
A
sine wave
input
is applied to the audio circuit being test-
ed.
The
same
sine wave
input
is applied to the vertical in-
put of the oscilloscope, and the
output
of the tested circuit
is
applied to the horizontal
input
of the oscilloscope. The
amount of phase difference between the two signals can
be calculated
from
the resulting waveform.
To
make phase measurements, use the
following
procedure.
1.
Using an audio signal generator
with
a pure sinusoidal
signal,
apply a sine wave test signal at the desired test
frequency to the audio network being tested.
2.
Set the signal generator
output
for the normal operating
level
of the circuit being tested. If desired, the circuit's
output
may be observed on the oscilloscope. If the test
circuit is overdriven, the sine wave display on the
oscil-
loscope
is clipped and the signal level must be reduced.
3.
Connect the channel 2 probe to the
output
of the test
circuit.
4.
Select
X-Y operation by placing the
TRIG
MODE switch
in the X-Y position.
5.
Connect the channel 1 probe to the
input
of the test
circuit.
(The
input
and
output
test connections to the vertical and
horizontal oscilloscope inputs may be reserved.)
6.
Adjust the channel 1 and 2 gain controls for a suitable
viewing
size.
7.
Some typical results are shown in Fig. 47.
If the two signals are in
phase,
the oscilloscope trace is
a
straight diagonal line. If the vertical and horizontal gain
are
properly adjusted, this line is at a 45° angle. A 90°
phase
shift produces a circular oscilloscope pattern.
Phase
shift of
less
(or more) than 90° produces an ellip-
tical oscilloscope pattern. The amount of phase shift can
be calculated
from
the oscilloscope trace as shown in Fig.
57.
32
•
Intensity modulation
area
A
Sweep
B
Sweep
 Loading...