-
-
-
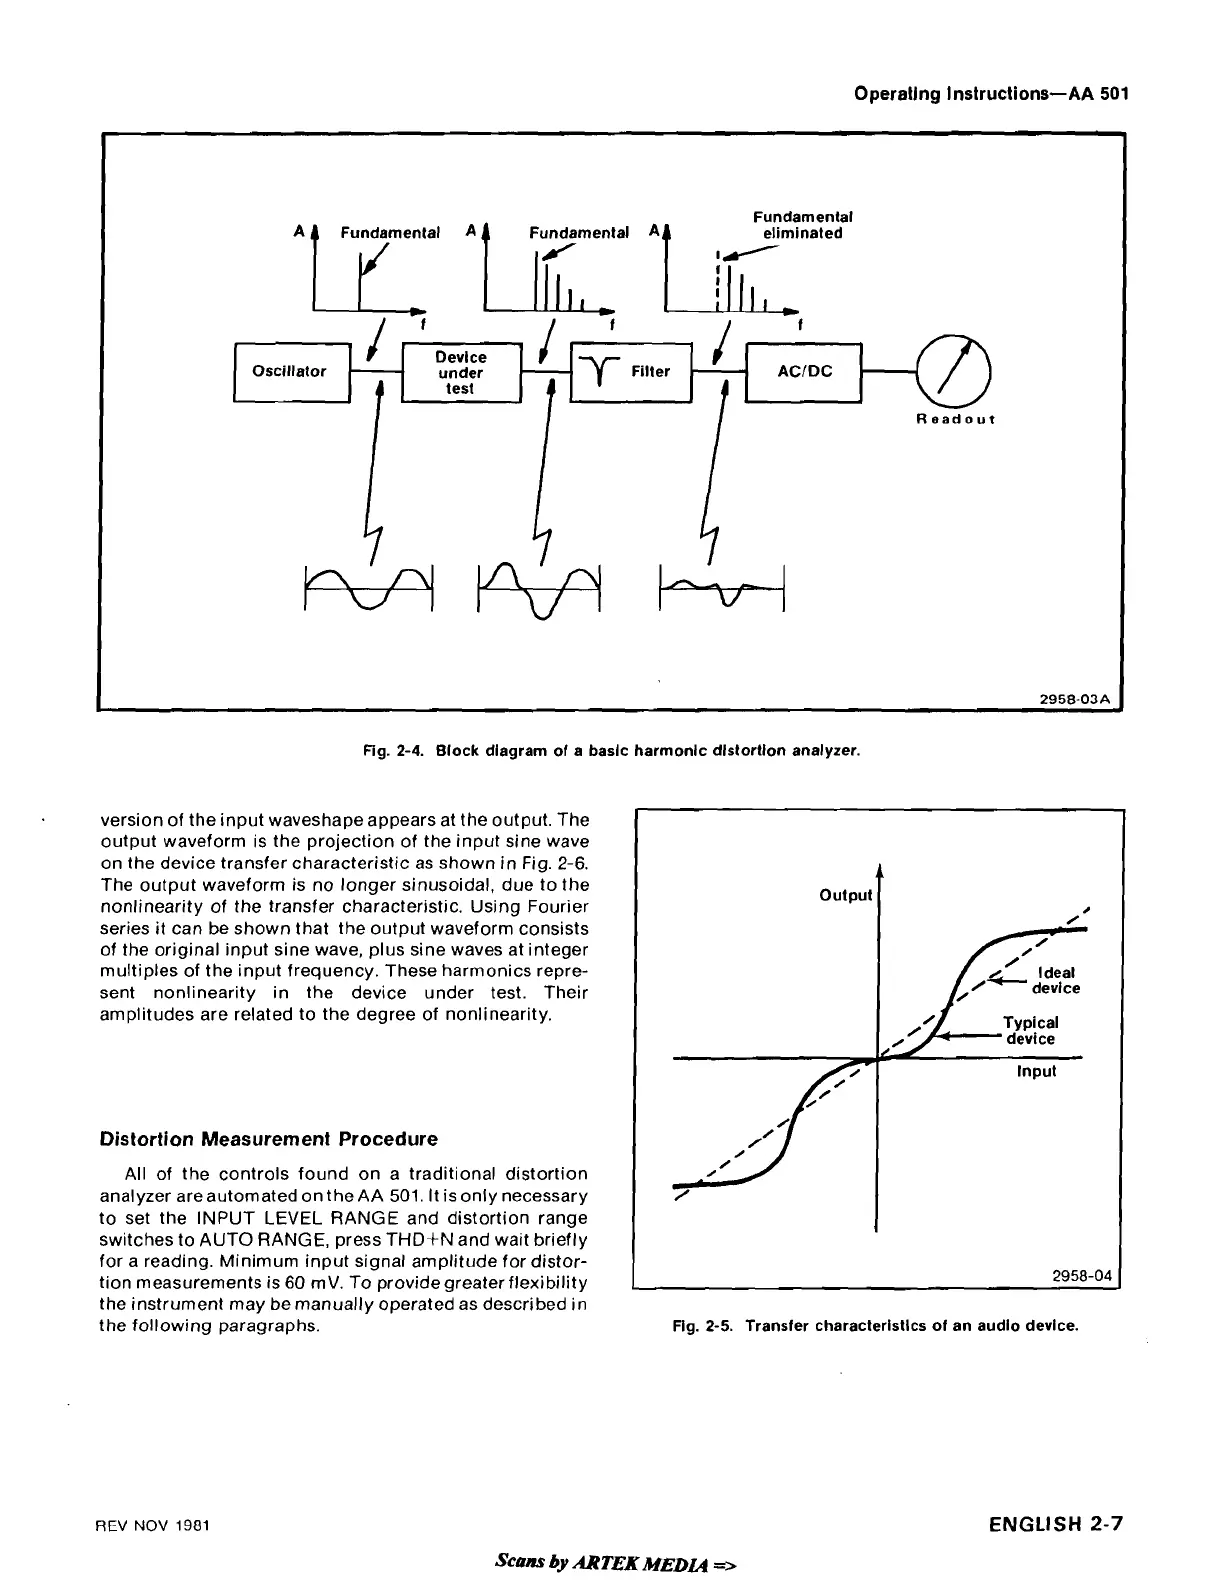
Fig.
2-4.
Block dlagram of
a
baslc harmonlc dlstortlon analyzer.
version of the input waveshape appears at the output. The
output waveform is the projection of the input sine wave
on the device transfer characteristic as shown in Fig.
2-6.
The output waveform is no longer sinusoidal, due to the
nonlinearity of the transfer characteristic. Using Fourier
series it can be shown that the output waveform consists
of the original input sine wave, plus sine waves at integer
multiples of the input frequency. These harmonics repre-
sent nonlinearity in the device under test. Their
amplitudes are related to the degree of nonlinearity.
Distortion Measurement Procedure
All of the controls found on a traditional distortion
analyzer areautomated on the
AA
501.
It isonly necessary
to set the INPUT LEVEL RANGE and distortion range
switches to AUTO RANGE, press
THD+N and wait briefly
for a reading. Minimum input signal amplitude for distor-
tion measurements is 60
mV. To
providegreaterflexibility
the instrument may be manually operated as described in
the following paragraphs.
Fig. 2-5. Transfer characterlstlcs of an audio device.
A
Output
4
0
2958-04
REV
NOV
1981
Scum
by
ARTEK
MEDU
ENGLISH
2-7
 Loading...