Operating Instructions-AA
501
measurement range in use. When using this featureit may
be desirable to select a manual range to prevent confusing
displays caused by autoranging.
Monitoring
The interface capabilities of the AA 501 may aid
considerably in the interpretation of measurements.
The INPUT MONITOR connector provides a fixed
amplitude version
(-1
V rms) of the input signal for input
signals of 50
mV or greater. This allows display of the
input signal on an oscilloscope, without constantly read-
justing the oscilloscope sensitivity. At input levels below
about 50
mVthe INPUT MONITOR signal isapproximate-
ly 26 dB (A =20) above the input signal level.
The FUNCTION OUTPUT is taken after the distortion
measurement and high gain amplifier circuitry. It can be
used for monitoring the signal read on the display. The
signal at the FUNCTION OUTPUT connector is
2
V for a
full scale reading on the display. In the level function this
connector becomes an amplified version of the input
signal. The gain from the input to this output is dependent
on the LEVEL RANGE switch, and is given in Table
2-1.
When the AA 501 is used as a constant gain differential
amplifier the INPUT LEVEL RANGE switch must be set to
a fixed range. In the distortion function this output can be
displayed
in an oscilloscope to view the distortion
components. This output may also be used to drive a
spectrum analyzer or selective voltmeter for examining
the individual harmonics or modulation products. When
an oscilloscope is used, the triggering signal is best taken
from the sync
output on the oscillator. If this is not
possible (for example in tape recorder or Telco link
testing) it should be obtained from the INPUT MONITOR
connector on the AA 501.
Table
2-1
Gains from INPUT terminals to
FUNCTION OUTPUT connector for
various settings of the
INPUT LEVEL RANGE control
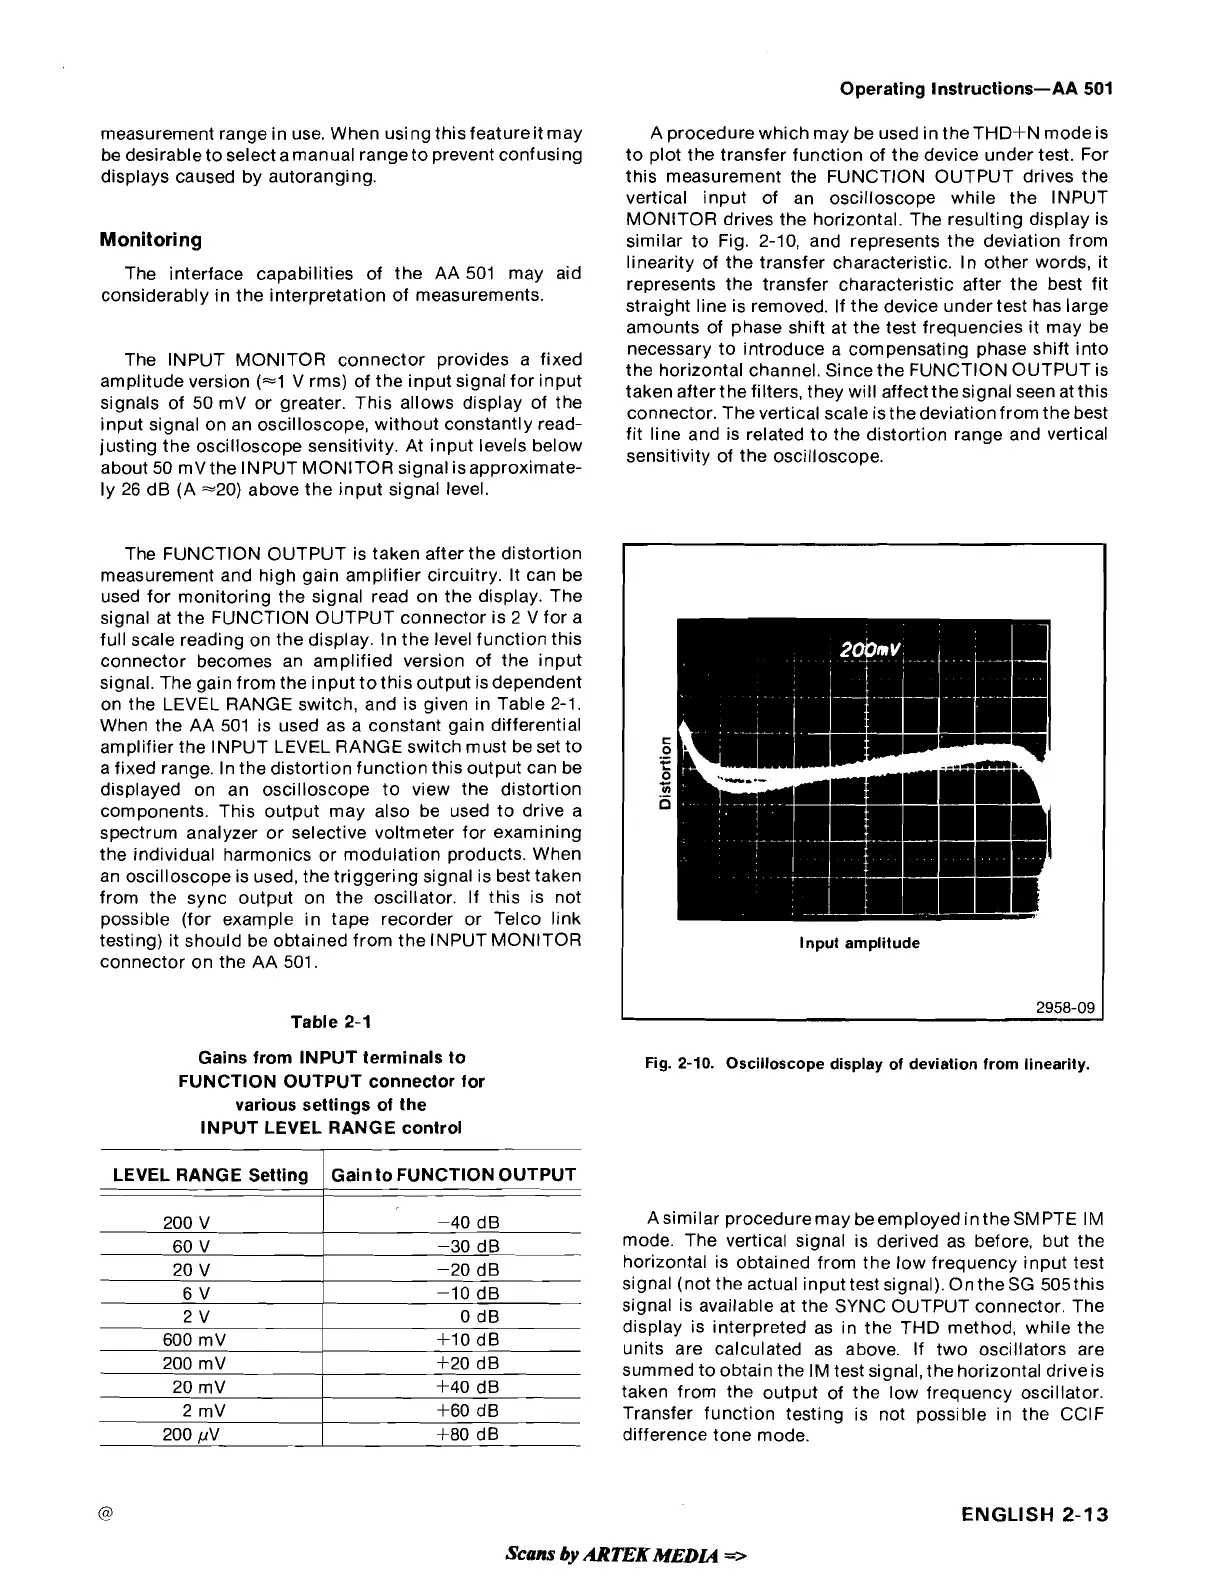
A procedure which may be used in
theTHD+N modeis
to plot the transfer function of the device under test. For
this measurement the FUNCTION OUTPUT drives the
vertical input of an oscilloscope while the INPUT
MONITOR drives the horizontal. The resulting display is
similar to Fig. 2-10, and represents the deviation from
linearity of the transfer characteristic. In other words, it
represents the transfer characteristic after the best fit
straight line is removed. If the device under test has large
amounts of phase shift at the test frequencies it may be
necessary to introduce a compensating phase shift into
the horizontal channel. Since the FUNCTION OUTPUT is
taken after the filters, they
will affectthesignal seen at this
connector. The vertical scale is the deviation from the best
fit line and is related to the distortion range and vertical
sensitivity of the oscilloscope.
I
C
0
.-
.-
z
.-
UI
ii
Input amplitude
2958-09
LEVEL RANGE Setting
Fig.
2-10.
Oscilloscope display of deviation from linearity.
Gain to FUNCTION OUTPUT
Asimilar proceduremay beemployedintheSMPTE IM
mode. The vertical signal is derived as before, but the
horizontal is obtained from the low frequency input test
signal (not the actual input test signal).
OntheSG 505this
signal is available at the SYNC OUTPUT connector. The
display is interpreted as in the THD method, while the
units are calculated as above. If two oscillators are
summed to obtain the
IM test signal, the horizontal drive is
taken from the output of the low frequency oscillator.
Transfer function testing is not possible in the
CClF
difference tone mode.
@
ENGLISH
2-13
Scans
by
AR
TEK
MEN
=>
 Loading...