BAS-SVX50F-EN 39
Data Graphs
Data graphs allow users to view trend logs from the Tracer UC600 controller in graphical format
on the TD7 Display. Up to eight data graphs can be created with a maximum of four data logs per
graph. Data graphs are user-defined and can be edited by changing the scale on the left and right
Y-axis and choosing the line color.
Touch the Da
ta Graphs button in the
bottom display area to view the Data Graphs screen
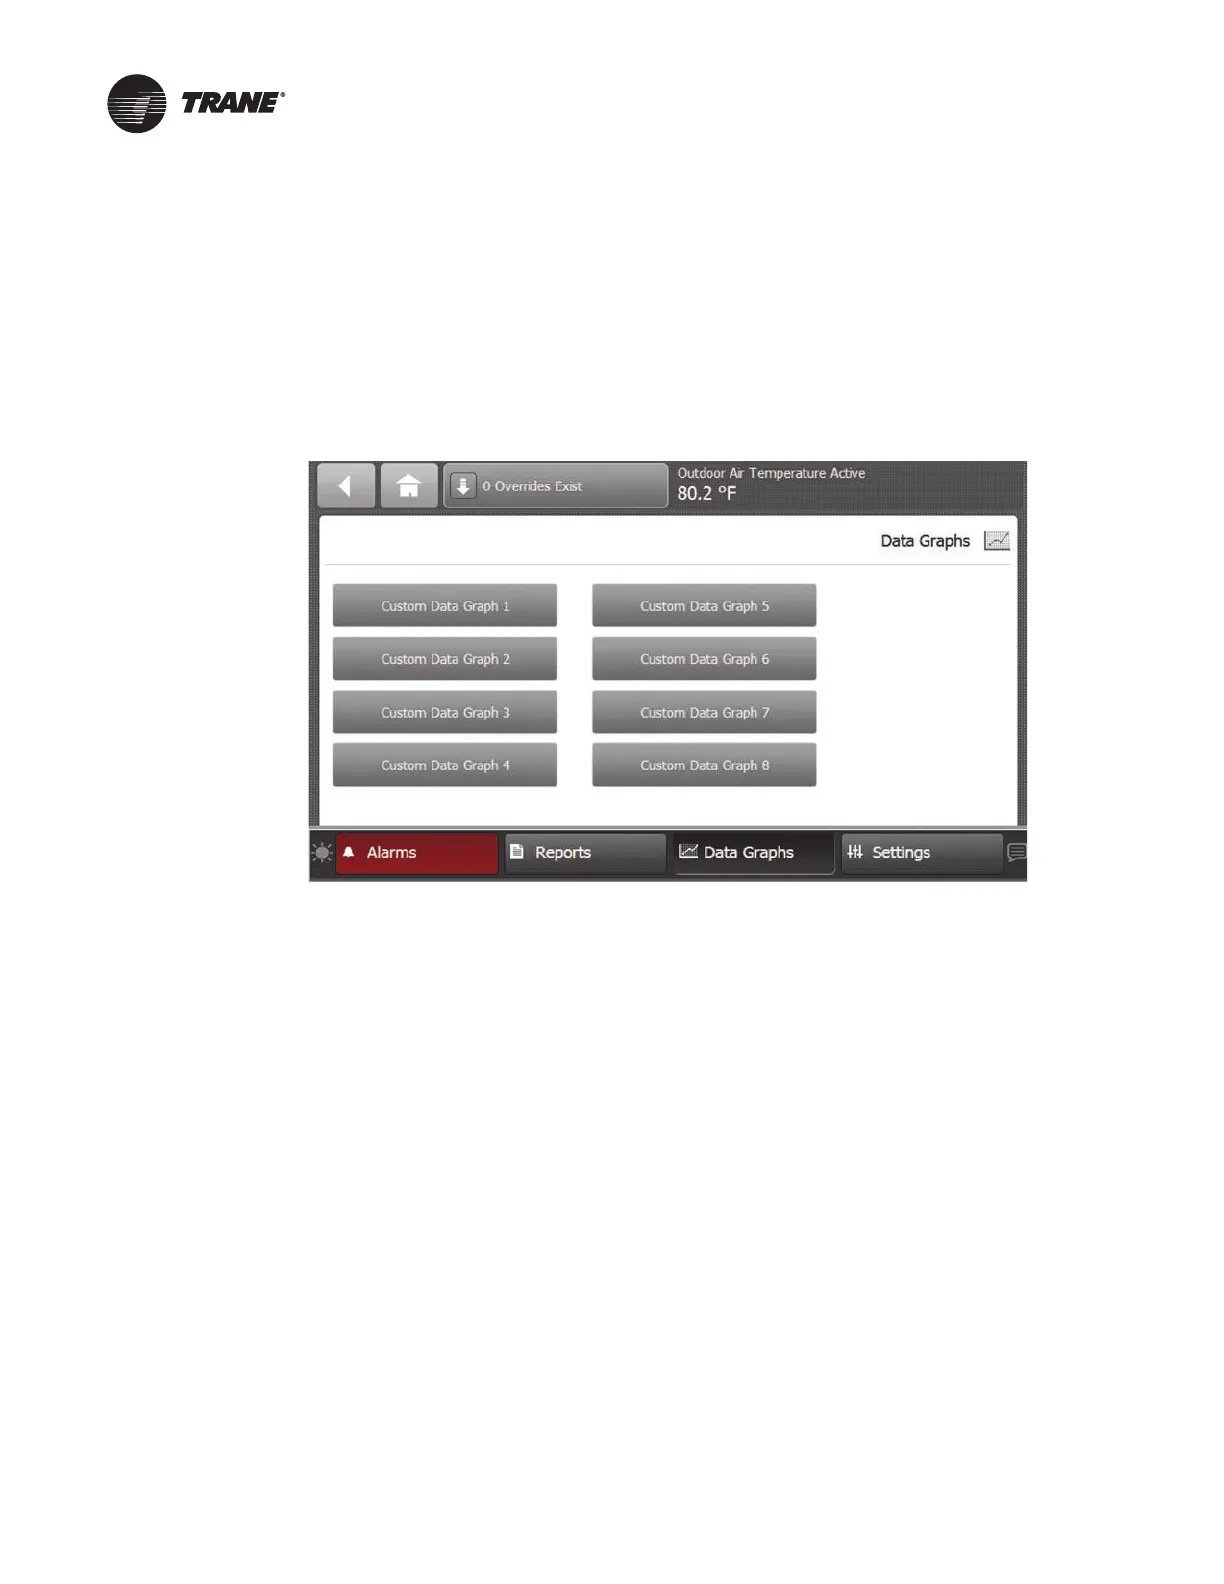
(Figure 28). The Data Graphs screen contains eight buttons that allow you to view and edit a
particular configuration.
Figure 28. Data Graphs screen
Creating a Data Graph
3. Navigate to the Data Graphs screen, then touch an available data graph button.
The Custom Data Graph screen appears.
4. Touch the Ed
it Data Graph button.
Th
e Edit Data Graph screen appears (Figure 29, p. 40).
 Loading...